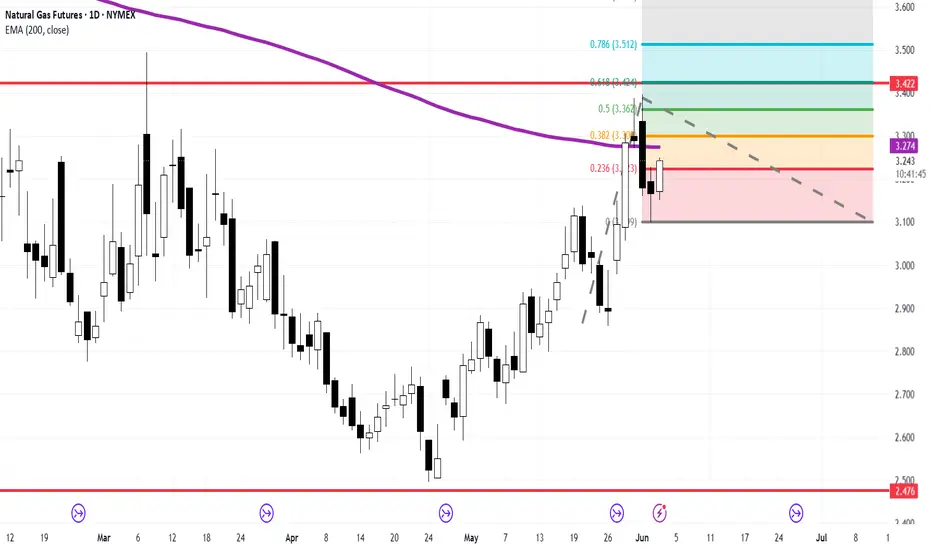
Natural Gas Futures ( NG1! - NYMEX) is displaying an aggressive recovery structure on the Daily (1D) chart. While the medium-term Fibonacci projections point toward higher targets, the asset is fast approaching a multi-layered institutional supply wall that demands strict technical caution.
### The Technical Framework:
* **The Bullish Structural Pivot:** After successfully defending the macro horizontal demand floor at **2.476** in late April, the asset established a sequence of higher lows and activated a structural bullish pivot, breaking above the March and May local peaks.
* **The Impending Confluence Cluster (3.422 - 3.446):** As price action attempts to expand deeper into the Fibonacci framework, a severe structural convergence zone is looming directly ahead:
* **Horizontal Resistance:** The key macro supply line is firmly set at **3.422**.
* **Fibonacci Confluence:** The crucial **0.618 Fibonacci retracement level** sits exactly at **3.424**.
* **The 200 EMA Baseline:** The long-term **200-period Exponential Moving Average (EMA 200 - purple line)** is currently tracking right at **3.446**.
### Price Action Observations & Local Rejection:
The chart shows that entering this overhead supply block will not be a simple task. The recent daily candle that spiked toward the 0.5 Fibonacci level (3.362) left a prominent upper rejection wick (selling tail), followed by immediate downside closes into early June. This confirms that institutional sellers are actively defending the approaches to the **3.42 - 3.45 cluster**.
### Strategic & Macro Outlook:
The dashed trajectory line illustrates a realistic, multi-phase technical sequence:
1. **The Corrective Throwback (Immediate Term):** Short-term momentum is undergoing a healthy mean-reversion pull-back. As long as the price maintains structural acceptance above the psychological $3.000 / $3.100 region, the broader bullish market structure remains intact.
2. **The Confluence Battle:** Once liquidity is re-accumulated, a renewed drive will test the tripple resistance wall (EMA 200 + 0.618 Fibo + 3.422 Horizontal). A daily candle acceptance above **3.450** is mandatory to unlock the extended upside projections toward **1.618 (3.949)** and **2.618 (4.474)**.
### Professional Playbook:
Chasing longs directly into a descending Daily 200 EMA blended with a 0.618 Fibonacci level carries a highly unfavorable risk-to-reward ratio. The optimal execution plan requires monitoring lower timeframes (such as H4 or H1) for stabilization signs near the immediate structural floors before looking to position for the next major retest of the macro resistance wall.
---
📊 **ProData Chart** | By Rogerio Zaglia
*Technical Analysis, Energy Markets & Global Asset Research.*
⚠️ **Disclaimer:** For educational and informational purposes only. This study does not constitute investment advice or trading recommendations. Past performance is not indicative of future results.
NG1! - NYMEX) is displaying an aggressive recovery structure on the Daily (1D) chart. While the medium-term Fibonacci projections point toward higher targets, the asset is fast approaching a multi-layered institutional supply wall that demands strict technical caution.### The Technical Framework:
* **The Bullish Structural Pivot:** After successfully defending the macro horizontal demand floor at **2.476** in late April, the asset established a sequence of higher lows and activated a structural bullish pivot, breaking above the March and May local peaks.
* **The Impending Confluence Cluster (3.422 - 3.446):** As price action attempts to expand deeper into the Fibonacci framework, a severe structural convergence zone is looming directly ahead:
* **Horizontal Resistance:** The key macro supply line is firmly set at **3.422**.
* **Fibonacci Confluence:** The crucial **0.618 Fibonacci retracement level** sits exactly at **3.424**.
* **The 200 EMA Baseline:** The long-term **200-period Exponential Moving Average (EMA 200 - purple line)** is currently tracking right at **3.446**.
### Price Action Observations & Local Rejection:
The chart shows that entering this overhead supply block will not be a simple task. The recent daily candle that spiked toward the 0.5 Fibonacci level (3.362) left a prominent upper rejection wick (selling tail), followed by immediate downside closes into early June. This confirms that institutional sellers are actively defending the approaches to the **3.42 - 3.45 cluster**.
### Strategic & Macro Outlook:
The dashed trajectory line illustrates a realistic, multi-phase technical sequence:
1. **The Corrective Throwback (Immediate Term):** Short-term momentum is undergoing a healthy mean-reversion pull-back. As long as the price maintains structural acceptance above the psychological $3.000 / $3.100 region, the broader bullish market structure remains intact.
2. **The Confluence Battle:** Once liquidity is re-accumulated, a renewed drive will test the tripple resistance wall (EMA 200 + 0.618 Fibo + 3.422 Horizontal). A daily candle acceptance above **3.450** is mandatory to unlock the extended upside projections toward **1.618 (3.949)** and **2.618 (4.474)**.
### Professional Playbook:
Chasing longs directly into a descending Daily 200 EMA blended with a 0.618 Fibonacci level carries a highly unfavorable risk-to-reward ratio. The optimal execution plan requires monitoring lower timeframes (such as H4 or H1) for stabilization signs near the immediate structural floors before looking to position for the next major retest of the macro resistance wall.
---
📊 **ProData Chart** | By Rogerio Zaglia
*Technical Analysis, Energy Markets & Global Asset Research.*
⚠️ **Disclaimer:** For educational and informational purposes only. This study does not constitute investment advice or trading recommendations. Past performance is not indicative of future results.

Aviso legal
As informações e publicações não se destinam a ser, e não constituem, conselhos ou recomendações financeiras, de investimento, comerciais ou de outro tipo fornecidos ou endossados pela TradingView. Leia mais nos Termos de Uso.
Aviso legal
As informações e publicações não se destinam a ser, e não constituem, conselhos ou recomendações financeiras, de investimento, comerciais ou de outro tipo fornecidos ou endossados pela TradingView. Leia mais nos Termos de Uso.