
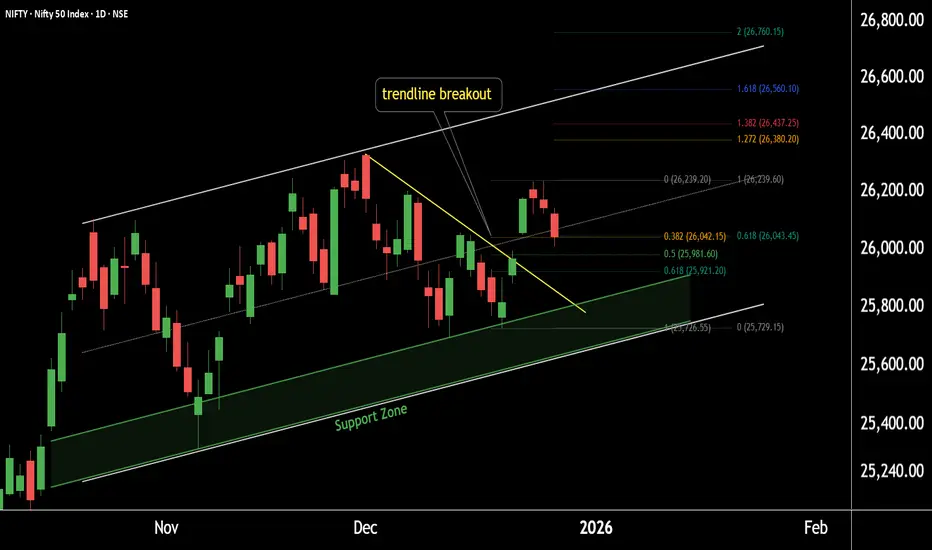
This is the daily timeframe chart of NIFTY.
NIFTY is trading within a well-defined structure, with higher-low (HL) support levels placed at 25,800 and 25,550.
On the lower timeframe, the index is showing a trendline breakout near 25,950, indicating short-term strength.
Based on Fibonacci retracement, the key reversal and decision zone lies between 25,900–25,950. If this support zone breaks, the next important support is positioned near 25,800.
If these support levels hold, NIFTY may continue its upward move. According to Fibonacci extension, the potential upside targets are 26,380–26,450, while 26,600 remains a major resistance, aligned with channel resistance and extension levels.
Thank You ....
NIFTY is trading within a well-defined structure, with higher-low (HL) support levels placed at 25,800 and 25,550.
On the lower timeframe, the index is showing a trendline breakout near 25,950, indicating short-term strength.
Based on Fibonacci retracement, the key reversal and decision zone lies between 25,900–25,950. If this support zone breaks, the next important support is positioned near 25,800.
If these support levels hold, NIFTY may continue its upward move. According to Fibonacci extension, the potential upside targets are 26,380–26,450, while 26,600 remains a major resistance, aligned with channel resistance and extension levels.
Thank You ....

@RahulSarawagi
Connect us at optionlab.co.in/
Connect us at optionlab.co.in/
Aviso legal
As informações e publicações não se destinam a ser, e não constituem, conselhos ou recomendações financeiras, de investimento, comerciais ou de outro tipo fornecidos ou endossados pela TradingView. Leia mais nos Termos de Uso.
@RahulSarawagi
Connect us at optionlab.co.in/
Connect us at optionlab.co.in/
Aviso legal
As informações e publicações não se destinam a ser, e não constituem, conselhos ou recomendações financeiras, de investimento, comerciais ou de outro tipo fornecidos ou endossados pela TradingView. Leia mais nos Termos de Uso.