
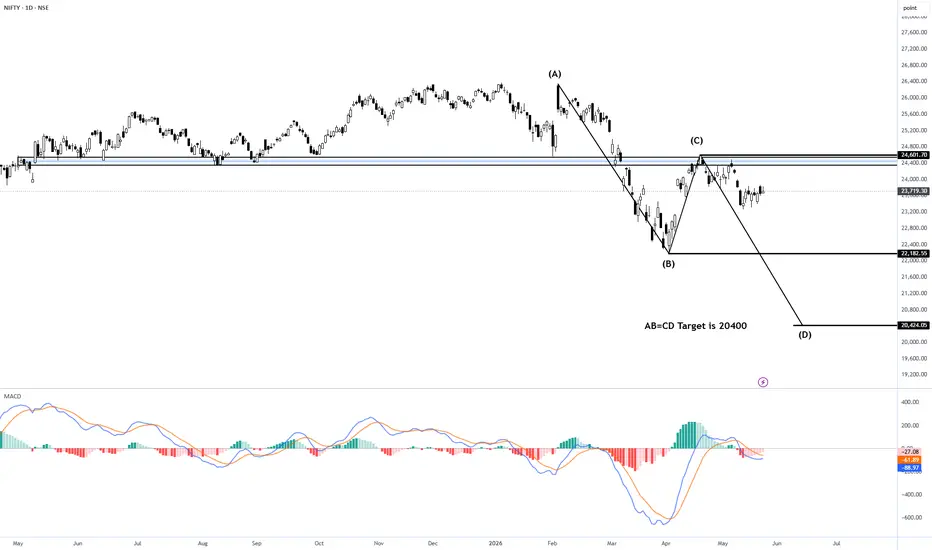
After a strong rally toward the 26k zone, NIFTY has started showing signs of structural weakness on the daily timeframe. The current setup is shaping into a classic AB=CD harmonic pattern, which often appears during corrective phases and trend reversals.
Pattern Breakdown
A → B Leg:
The first impulsive decline started from the recent swing high near 26,000 and extended sharply toward the 22,200 support area. This move established the initial bearish momentum leg.
B → C Retracement:
From the 22,200 low, NIFTY witnessed a relief rally back toward the important resistance zone around 24,600–24,800.
This area previously acted as:
major support,
breakdown level,
and now a potential supply zone.
Price rejection from this zone confirms sellers are still active.
C → D Projection:
If the AB=CD symmetry completes, the projected downside target comes near 20,400, which aligns with the measured move projection and harmonic completion zone.
Key Levels to Watch
Resistance Zone
24,600 – 24,800
Multiple rejections visible
Important breakdown retest area
Immediate Support
22,180 – 22,200
Swing low support
Breakdown below this level can accelerate bearish momentum
Harmonic Target (Point D)
20,400
AB=CD measured move completion
Possible demand/reversal zone
Momentum & Indicator Observation
The oscillator below the chart is also showing weakening momentum after the recent pullback from resistance. Bearish crossover and fading histogram strength suggest buyers are losing control in the short term.
Unless NIFTY reclaims and sustains above the 24,800 resistance zone, the probability of downside continuation remains elevated.
Trading Perspective
Bearish below: 24,800
Confirmation breakdown: 22,200
Projected target: 20,400
Traders should closely monitor price behavior near the support zones because volatility may increase once the structure confirms.
Conclusion
The market is currently at a critical decision point. The AB=CD harmonic setup indicates that the ongoing correction may not be over yet. A sustained rejection from the resistance zone could trigger another bearish leg toward the 20,400 area in the coming sessions.
Patience and confirmation remain key.
Pattern Breakdown
A → B Leg:
The first impulsive decline started from the recent swing high near 26,000 and extended sharply toward the 22,200 support area. This move established the initial bearish momentum leg.
B → C Retracement:
From the 22,200 low, NIFTY witnessed a relief rally back toward the important resistance zone around 24,600–24,800.
This area previously acted as:
major support,
breakdown level,
and now a potential supply zone.
Price rejection from this zone confirms sellers are still active.
C → D Projection:
If the AB=CD symmetry completes, the projected downside target comes near 20,400, which aligns with the measured move projection and harmonic completion zone.
Key Levels to Watch
Resistance Zone
24,600 – 24,800
Multiple rejections visible
Important breakdown retest area
Immediate Support
22,180 – 22,200
Swing low support
Breakdown below this level can accelerate bearish momentum
Harmonic Target (Point D)
20,400
AB=CD measured move completion
Possible demand/reversal zone
Momentum & Indicator Observation
The oscillator below the chart is also showing weakening momentum after the recent pullback from resistance. Bearish crossover and fading histogram strength suggest buyers are losing control in the short term.
Unless NIFTY reclaims and sustains above the 24,800 resistance zone, the probability of downside continuation remains elevated.
Trading Perspective
Bearish below: 24,800
Confirmation breakdown: 22,200
Projected target: 20,400
Traders should closely monitor price behavior near the support zones because volatility may increase once the structure confirms.
Conclusion
The market is currently at a critical decision point. The AB=CD harmonic setup indicates that the ongoing correction may not be over yet. A sustained rejection from the resistance zone could trigger another bearish leg toward the 20,400 area in the coming sessions.
Patience and confirmation remain key.
Nota
here is also possiblity of W pattern
like this
Nota
Disclaimer :- Technical Analysis Charts provided for study, learning and research purpose. Please be aware of the risk's involved in trading & seek independent advice, if necessary.I am not a Certified registered analysist
this is just my observation for practice and learning purpose of chart reading,
Must take advice from your financial advisor before actual trade
Nota
in any case if we can two day closing above 24600 trend changed to bullish completely 
Publicações relacionadas
Aviso legal
As informações e publicações não se destinam a ser, e não constituem, conselhos ou recomendações financeiras, de investimento, comerciais ou de outro tipo fornecidos ou endossados pela TradingView. Leia mais nos Termos de Uso.
Publicações relacionadas
Aviso legal
As informações e publicações não se destinam a ser, e não constituem, conselhos ou recomendações financeiras, de investimento, comerciais ou de outro tipo fornecidos ou endossados pela TradingView. Leia mais nos Termos de Uso.