
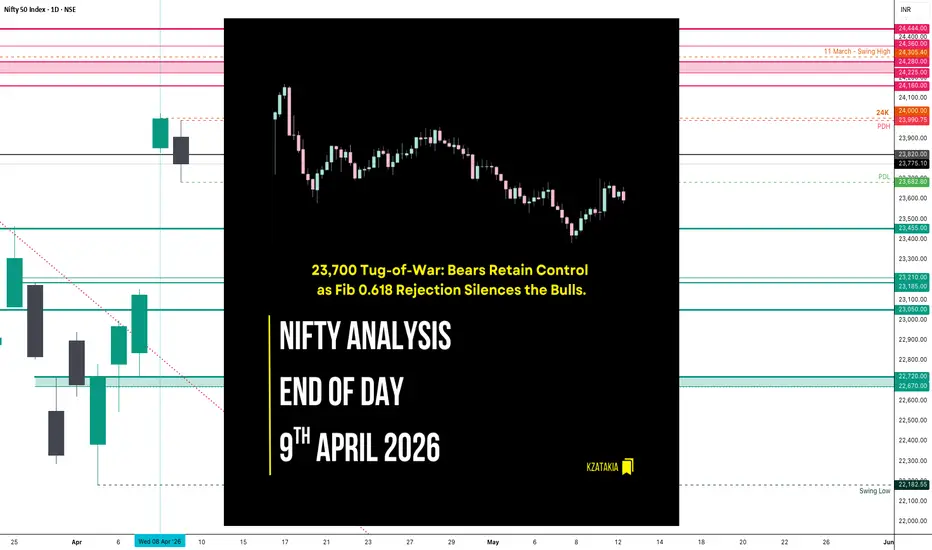
🟢 Nifty Analysis EOD – April 9, 2026 – Thursday 🔴
23,700 Tug-of-War: Bears Retain Control as Fib 0.618 Rejection Silences the Bulls.
🗞 Nifty Summary
Today’s session was a winding journey of recoveries and sharp rejections.
Nifty opened with an 88-point Gap Down and slipped another 107 points within the very first minute. However, a sharp 175-point recovery immediately followed, lifting the index toward the PDC and marking a day high of 23,990.75. Once again, the selling pressure near the 24,000 mark proved too much; a sharp sell-off pushed the index down 231 points to hit 23,760.
A struggling 145-point recovery followed, but it only led the index back to the Fib 0.618 level—which turned out to be a lucrative entry point for sellers. This triggered another leg down, dropping the Nifty 220 points as it breached the 23,820 support, the PDL, and the IBL, eventually hitting a new low of 23,682.80.
At the 23,700 level, a late 125-point bounce occurred, trapping those who sold the IBL breakout. Despite this recovery, the index respected the intraday trendline and closed at 23,766.05, which is about 83 points above the day’s low.
Overall, while the bears controlled the day, the recovery attempts show that the bulls are still fighting for their “fort.” Today’s range was 308 points—roughly half of the Gladiator Indicator’s average ATR (508.98)—leading me to view this as another consolidation day.
🛡 5 Min Intraday Chart with Levels

📉 Daily Time Frame Chart with Intraday Levels

🕯 Daily Candle Breakdown
Open: 23,909.05
High: 23,990.75
Low: 23,682.80
Close: 23,775.10
Change: −222.25 (−0.93%)
🏗️ Structure Breakdown
Type: Bearish candle.
Range: ≈ 308 points — high intraday volatility.
Body: ≈ 134 points — moderate selling pressure.
Upper Wick: ≈ 82 points — clear rejection from the 24,000 zone.
Lower Wick: ≈ 92 points — buying support visible near the day’s low.
🛡 5 Min Intraday Chart

⚔️ Gladiator Strategy Update
ATR: 508.98
IB Range: 231.30 → Medium
Market Structure: Balanced
Trade Highlights:
No Trade
Trade Summary: I was not available at my desk today. My personal trading rules are very strict: I do not take trades if I am not physically at my desk to monitor them. Even if the market presents opportunities, staying disciplined to my own setup is more important than chasing a move.
🧱 Support & Resistance Levels
Resistance Zones: 24,160 | 24,225 ~ 24,280 | 24,360 | 24,444
Support Zones: 23,700 | 23,580 | 23,455
🧠 Final Thoughts
“In a 300-point range, the loudest move is often a trap for the impatient.”
The 23,700 ~ 24,000 zone has become a high-alert minefield for intraday traders.
For tomorrow’s session, I am leaning toward a bearish stance unless we get a close above 23,920. The area between 23,800 ~ 23,920 is a “No-Trade Zone” for me.
Since tomorrow is the last day of the week and Monday brings the weekly expiry, I’ll be extra attentive to how we close. Plan your trades carefully and respect the levels.
✏️ Disclaimer
This is my personal digital diary and represents my own analysis and point of view. It is not financial advice; please consult a professional advisor before making any trading decisions.
23,700 Tug-of-War: Bears Retain Control as Fib 0.618 Rejection Silences the Bulls.
🗞 Nifty Summary
Today’s session was a winding journey of recoveries and sharp rejections.
Nifty opened with an 88-point Gap Down and slipped another 107 points within the very first minute. However, a sharp 175-point recovery immediately followed, lifting the index toward the PDC and marking a day high of 23,990.75. Once again, the selling pressure near the 24,000 mark proved too much; a sharp sell-off pushed the index down 231 points to hit 23,760.
A struggling 145-point recovery followed, but it only led the index back to the Fib 0.618 level—which turned out to be a lucrative entry point for sellers. This triggered another leg down, dropping the Nifty 220 points as it breached the 23,820 support, the PDL, and the IBL, eventually hitting a new low of 23,682.80.
At the 23,700 level, a late 125-point bounce occurred, trapping those who sold the IBL breakout. Despite this recovery, the index respected the intraday trendline and closed at 23,766.05, which is about 83 points above the day’s low.
Overall, while the bears controlled the day, the recovery attempts show that the bulls are still fighting for their “fort.” Today’s range was 308 points—roughly half of the Gladiator Indicator’s average ATR (508.98)—leading me to view this as another consolidation day.
🛡 5 Min Intraday Chart with Levels
📉 Daily Time Frame Chart with Intraday Levels
🕯 Daily Candle Breakdown
Open: 23,909.05
High: 23,990.75
Low: 23,682.80
Close: 23,775.10
Change: −222.25 (−0.93%)
🏗️ Structure Breakdown
Type: Bearish candle.
Range: ≈ 308 points — high intraday volatility.
Body: ≈ 134 points — moderate selling pressure.
Upper Wick: ≈ 82 points — clear rejection from the 24,000 zone.
Lower Wick: ≈ 92 points — buying support visible near the day’s low.
🛡 5 Min Intraday Chart
⚔️ Gladiator Strategy Update
ATR: 508.98
IB Range: 231.30 → Medium
Market Structure: Balanced
Trade Highlights:
No Trade
Trade Summary: I was not available at my desk today. My personal trading rules are very strict: I do not take trades if I am not physically at my desk to monitor them. Even if the market presents opportunities, staying disciplined to my own setup is more important than chasing a move.
🧱 Support & Resistance Levels
Resistance Zones: 24,160 | 24,225 ~ 24,280 | 24,360 | 24,444
Support Zones: 23,700 | 23,580 | 23,455
🧠 Final Thoughts
“In a 300-point range, the loudest move is often a trap for the impatient.”
The 23,700 ~ 24,000 zone has become a high-alert minefield for intraday traders.
For tomorrow’s session, I am leaning toward a bearish stance unless we get a close above 23,920. The area between 23,800 ~ 23,920 is a “No-Trade Zone” for me.
Since tomorrow is the last day of the week and Monday brings the weekly expiry, I’ll be extra attentive to how we close. Plan your trades carefully and respect the levels.
✏️ Disclaimer
This is my personal digital diary and represents my own analysis and point of view. It is not financial advice; please consult a professional advisor before making any trading decisions.

Read my blogs here:
substack.com/@kzatakia
Follow me on Telegram:
t.me/swingtraderhub
Follow me on X:
x.com/kzatakia
substack.com/@kzatakia
Follow me on Telegram:
t.me/swingtraderhub
Follow me on X:
x.com/kzatakia
Publicações relacionadas
Aviso legal
As informações e publicações não se destinam a ser, e não constituem, conselhos ou recomendações financeiras, de investimento, comerciais ou de outro tipo fornecidos ou endossados pela TradingView. Leia mais nos Termos de Uso.
Read my blogs here:
substack.com/@kzatakia
Follow me on Telegram:
t.me/swingtraderhub
Follow me on X:
x.com/kzatakia
substack.com/@kzatakia
Follow me on Telegram:
t.me/swingtraderhub
Follow me on X:
x.com/kzatakia
Publicações relacionadas
Aviso legal
As informações e publicações não se destinam a ser, e não constituem, conselhos ou recomendações financeiras, de investimento, comerciais ou de outro tipo fornecidos ou endossados pela TradingView. Leia mais nos Termos de Uso.