
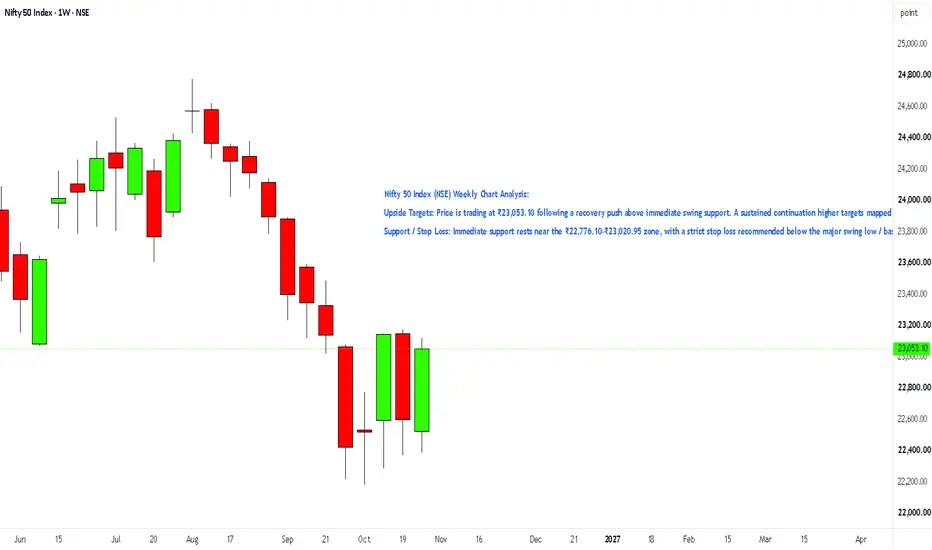
Nifty 50 Index (NSE) Weekly Chart Analysis:
Upside Targets: Price is trading at ₹23,053.10 following a recovery push above immediate swing support. A sustained continuation higher targets mapped levels at ₹23,569.70 (T1), ₹23,848.85 (T2), and ₹24,300.45 (T3).
Support / Stop Loss: Immediate support rests near the ₹22,776.10–₹23,020.95 zone, with a strict stop loss recommended below the major swing low / base near ₹22,179.90 to manage downside risk.
Upside Targets: Price is trading at ₹23,053.10 following a recovery push above immediate swing support. A sustained continuation higher targets mapped levels at ₹23,569.70 (T1), ₹23,848.85 (T2), and ₹24,300.45 (T3).
Support / Stop Loss: Immediate support rests near the ₹22,776.10–₹23,020.95 zone, with a strict stop loss recommended below the major swing low / base near ₹22,179.90 to manage downside risk.

Automated Tools/Indicators/Screeners available at kkonline.org/nimblrta
Aviso legal
As informações e publicações não se destinam a ser, e não constituem, conselhos ou recomendações financeiras, de investimento, comerciais ou de outro tipo fornecidos ou endossados pela TradingView. Leia mais nos Termos de Uso.
Automated Tools/Indicators/Screeners available at kkonline.org/nimblrta
Aviso legal
As informações e publicações não se destinam a ser, e não constituem, conselhos ou recomendações financeiras, de investimento, comerciais ou de outro tipo fornecidos ou endossados pela TradingView. Leia mais nos Termos de Uso.