
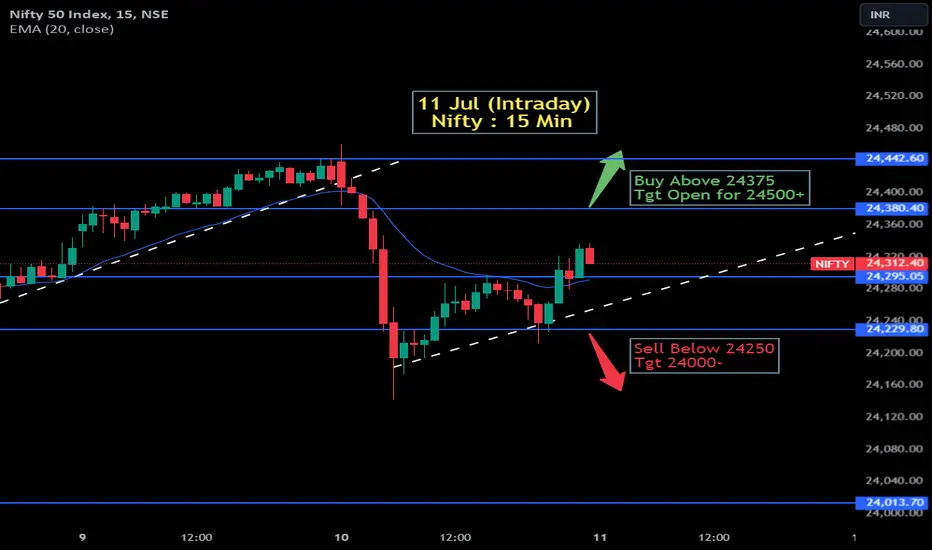
The image you provided is a TradingView screenshot showing a 15-minute candlestick chart of the Nifty 50 index from July 9 to July 11. This chart features several technical details:
Date and Time: The chart includes timestamps, helping to track price movements throughout the trading days depicted.
Exponential Moving Average (EMA): A 20-period EMA is plotted, which helps in determining the trend and potential support or resistance areas.
Trading Signals:
-Buy Signal: There's a green arrow pointing upwards with the annotation "Buy Above 24375 Tgt Open for 24500+". This indicates a potential bullish breakout strategy where buying is recommended above 24,375 with an open target extending towards 24,500 or beyond.
-Sell Signal: A red arrow points downwards with the annotation "Sell Below 24250 Tgt 24000-". This suggests a bearish strategy recommending selling below 24,250 aiming for a target around 24,000.
Date and Time: The chart includes timestamps, helping to track price movements throughout the trading days depicted.
Exponential Moving Average (EMA): A 20-period EMA is plotted, which helps in determining the trend and potential support or resistance areas.
Trading Signals:
-Buy Signal: There's a green arrow pointing upwards with the annotation "Buy Above 24375 Tgt Open for 24500+". This indicates a potential bullish breakout strategy where buying is recommended above 24,375 with an open target extending towards 24,500 or beyond.
-Sell Signal: A red arrow points downwards with the annotation "Sell Below 24250 Tgt 24000-". This suggests a bearish strategy recommending selling below 24,250 aiming for a target around 24,000.

Aviso legal
As informações e publicações não se destinam a ser, e não constituem, conselhos ou recomendações financeiras, de investimento, comerciais ou de outro tipo fornecidos ou endossados pela TradingView. Leia mais nos Termos de Uso.
Aviso legal
As informações e publicações não se destinam a ser, e não constituem, conselhos ou recomendações financeiras, de investimento, comerciais ou de outro tipo fornecidos ou endossados pela TradingView. Leia mais nos Termos de Uso.