
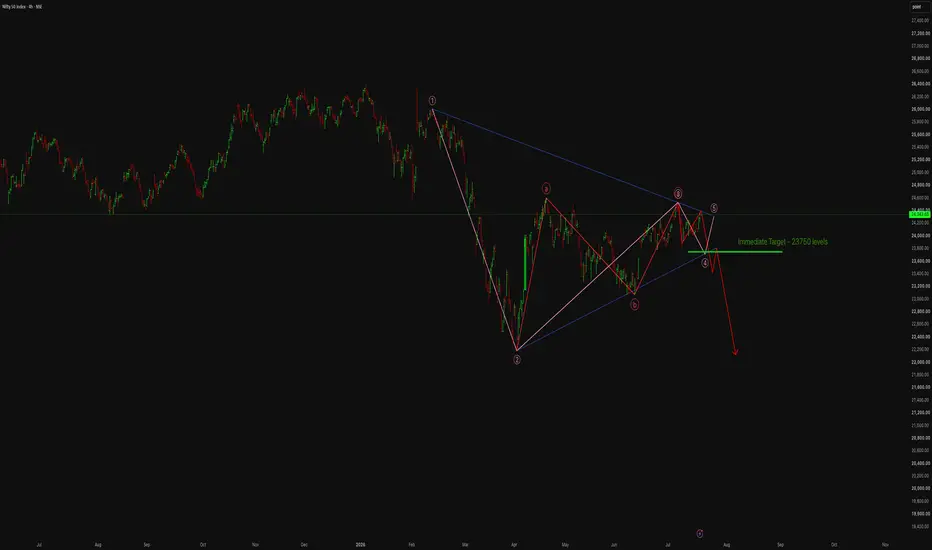
## NIFTY 50 – 4-Hour Chart Analysis
1. Nifty is trading inside a **large symmetrical triangle**, indicating a period of consolidation where buyers and sellers are preparing for the next major directional move.
2. Price is currently approaching the **upper trendline resistance near 24,350–24,400**, a zone where multiple previous rejections have occurred, making it a crucial resistance level.
3. The Elliott Wave structure suggests that **Wave (5)** of the corrective rally is nearing completion, increasing the probability of a short-term reversal.
4. The chart indicates an **ABC corrective pattern** has likely completed, and failure to break above the triangle resistance could trigger a fresh bearish impulse.
5. The immediate support is around **23,750**, which is also highlighted on the chart as the first downside target after a breakdown.
6. A decisive close below **23,750** would confirm the breakdown from the triangle and could accelerate selling towards **23,200–22,900**.
7. The lower ascending trendline has supported prices several times, but repeated tests generally weaken support, increasing the probability of an eventual breakdown.
8. A sustained breakout above **24,400** with strong volume would invalidate the bearish setup and could lead to a rally towards **24,700–25,000**.
9. Traders should closely monitor the **24,350–24,400 resistance** and **23,750 support**, as a breakout from either level is likely to determine the next medium-term trend.
10. **Overall Outlook: Moderately Bearish (7.5/10)** with the expected path: **24,340 → 24,400 (Resistance) → 23,750 → 23,200 → 22,900**, while **24,400** remains the key breakout and invalidation level.
---
### Disclaimer
> **Disclaimer:** This analysis is based on technical indicators, Elliott Wave interpretation, chart patterns, trendline analysis, support and resistance levels, and the current market structure. It is intended **solely for educational and informational purposes** and **should not be considered financial or investment advice**. Financial markets are inherently volatile, and no technical analysis can guarantee future price movements. Please conduct your own research and consult a qualified financial advisor before making any investment or trading decisions.

Aviso legal
As informações e publicações não se destinam a ser, e não constituem, conselhos ou recomendações financeiras, de investimento, comerciais ou de outro tipo fornecidos ou endossados pela TradingView. Leia mais nos Termos de Uso.
Aviso legal
As informações e publicações não se destinam a ser, e não constituem, conselhos ou recomendações financeiras, de investimento, comerciais ou de outro tipo fornecidos ou endossados pela TradingView. Leia mais nos Termos de Uso.