
Nvidia (NVDA) shares popped 5% in extended trading on Wednesday after the AI favorite posted quarterly results well above Wall Street expectations and issued a strong sales forecast, signaling that the AI boom is showing no signs of slowing.
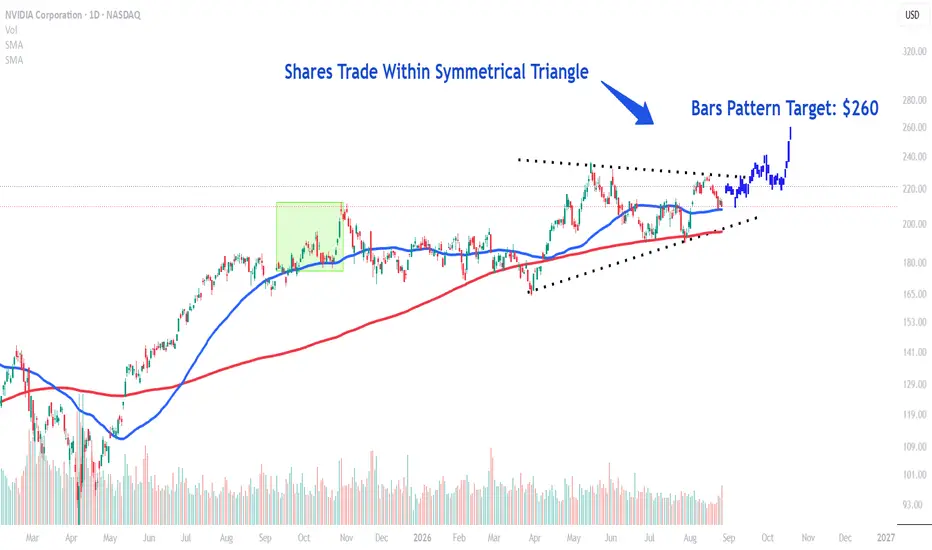
Taking a closer look at NVDA's chart, the shares have traded within a multi-month symmetrical triangle, potentially indicating accumulation by institutional investors before the stock continues its longer-term uptrend. More recently, the price has retraced to the closely-watched 50 moving average (MA) ahead of today's earnings report.
Traders can project a bullish target by using TradingView's bar pattern tool. To apply the analysis, we take the price bars comprising a move higher following a similar-sized gap after a pullback to the 50 MA in September last year and overlay them from Thursday's projected opening price. This forecasts a move to around $260, implying around 24% upside from Wednesday's closing price.

Aviso legal
As informações e publicações não se destinam a ser, e não constituem, conselhos ou recomendações financeiras, de investimento, comerciais ou de outro tipo fornecidos ou endossados pela TradingView. Leia mais nos Termos de Uso.
Aviso legal
As informações e publicações não se destinam a ser, e não constituem, conselhos ou recomendações financeiras, de investimento, comerciais ou de outro tipo fornecidos ou endossados pela TradingView. Leia mais nos Termos de Uso.