
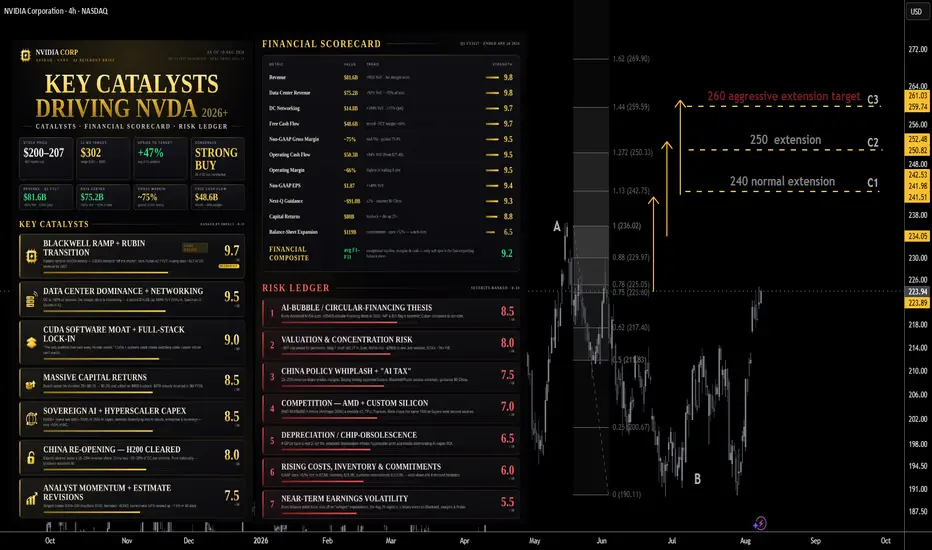
NVDA (2026+) Catalysts, Risks & Financials: Ranked Analyst Views
As of August 10, 2026. Stock ~$222–223. Consensus rating Strong Buy (58 of 61 analysts buy/strong-buy); average 12-month price target ~$302–304 (~+47% upside); range $180 (low) → $500 (high). Next earnings ~Aug 26–27, 2026 (Q2 FY2027). Latest reported quarter: Q1 FY2027 (ended Apr 26, 2026) — record revenue $81.6B (+85% YoY), Data Center $75.2B (+92% YoY).
🔑 Key Catalysts Driving NVDA (2026+)
🏗️ Blackwell Ramp + Rubin Transition (the core engine)
Blackwell is the fastest product ramp in NVIDIA's history — GB300 NVL72 demand described as "off the charts," with frontier labs and hyperscalers cumulatively deploying hundreds of thousands of GPUs. Next-gen Vera Rubin is on track for an H2 FY2027 ramp, giving a built-in upgrade cycle. Jensen Huang forecast at GTC 2026 that AI data-center revenue could reach ~$1 trillion by 2027, with ~25% upside beyond that including CPU/systems. Impact Score: 9.7/10
🌐 Data Center Dominance & Networking Explosion
Data Center is ~92% of total revenue ($75.2B in Q1 FY2027). The under-appreciated story is networking: DC networking revenue hit a record $14.8B, up 199% YoY (NVLink scale-up, Spectrum-X Ethernet, Quantum-X InfiniBand). This turns NVIDIA from a chip vendor into a full rack-scale systems supplier and deepens the moat. Impact Score: 9.5/10
🧠 CUDA Software Moat & Full-Stack Lock-In
"NVIDIA is the only platform that runs every frontier AI model" (Huang) — Anthropic, OpenAI, Meta, Google Gemini, xAI. CUDA + the systems stack create switching costs that custom silicon struggles to match, sustaining pricing power and mid-70s gross margins. Impact Score: 9/10
💵 Massive Capital Returns (Dividend + Buyback)
On May 18, 2026 the board raised the quarterly dividend 25× (from $0.01 to $0.25) and added an $80B buyback authorization (no expiration). First nine months of FY2026 already returned $37B to shareholders. Signals management confidence and provides a valuation floor. Impact Score: 8.5/10
🌍 Sovereign AI + Hyperscaler Capex Supercycle
Microsoft, Amazon, Alphabet, Meta, Oracle are guiding to ~$140B+ (some estimates $650–700B across top firms) of AI capex in 2026. Data Center is diversifying beyond hyperscale into AI Clouds, industrial, enterprise and sovereign customers (now ~50% of DC), broadening and de-risking the demand base. Impact Score: 8.5/10
🇨🇳 China Re-Opening (H200 with Revenue-Share)
The Trump administration cleared H200 exports to China under a 15–25% revenue-share ("AI tax") framework with Commerce licensing. China was ~20–25% of DC revenue pre-controls (~$10–15B/yr). Huang says demand is "very high" and hasn't ruled out Blackwell/Rubin for China "in time." Upside optionality not currently baked into guidance (management assumes $0 China DC compute in the outlook). Impact Score: 8/10
📈 Analyst Momentum & Estimate Revisions
Strong Buy consensus; targets clustering $300–330 (KeyBanc $330, Bernstein sees a break above $300). Current-year EPS estimates revised up ~7.8% in 90 days. Positive revision momentum tends to pull in institutional flows. Impact Score: 7.5/10
⚠️ Key Risks & Negative Drivers
🫧 AI-Bubble / Circular-Financing Thesis
The loudest bear case. Michael Burry disclosed sizable NVDA puts (Jul 2026), arguing much demand is vendor-financed and off-balance-sheet, with "future revenues majority financed in a circular arrangement." NVIDIA has announced >$540B of circular-financing deals in 2026 (Bloomberg). BofA's semiconductor Bubble Risk Indicator hit 0.91; IMF and BIS both flagged AI circular financing as a systemic risk. Mark Cuban compared it to the dot-com burst. Risk Severity: 8.5/10
💸 Valuation & Concentration Risk
Multi-trillion-dollar market cap (~$5T) priced for sustained hypergrowth. Magnificent-7 shed >$2.2T in June 2026 alone; NVDA lost ~$250B cap in a single July session on bubble fears. Any guidance wobble → sharp de-rating. Semiconductor ETF (SOXX) trading at ~76× P/E. Risk Severity: 8/10
🇨🇳 China Policy Whiplash & The "AI Tax"
Even with H200 clearance, the 15–25% revenue-share erodes margins, Beijing is reportedly limiting approved buyers, and $0 China DC compute is currently in guidance — a reminder of how fast policy can swing (Q1 FY26 had $4.6B China Hopper; Q1 FY27 had none). Blackwell/Rubin access remains uncertain. Risk Severity: 7.5/10
🥊 Competitive Pressure (AMD + Custom Silicon)
AMD's MI400/MI450 + Helios racks (incl. the Anthropic 2GW deal) are a credible #2, and hyperscaler custom silicon (Google TPU, AWS Trainium, Microsoft Maia) targets the same TAM. Sustained share/margin defense is not guaranteed as buyers seek second sources. Risk Severity: 7/10
📉 Depreciation & Chip-Obsolescence Accounting
Burry's secondary thesis: if AI GPUs have a real 2–3 year useful life, hyperscalers' extended depreciation schedules inflate reported profits and mask deteriorating ROI on AI capex — which could slow the capex supercycle NVIDIA depends on. Risk Severity: 6.5/10
⚡ Rising Costs, Inventory & Commitments
GAAP opex +52% YoY to $7.6B; inventory $25.8B; supply/purchase commitments $119.0B. Aggressive capacity build-out raises execution and write-down risk if demand ever hesitates (the balance-sheet-expansion factor analysts flag). Risk Severity: 6/10
🔀 Near-Term Earnings Volatility
Even blowout prints have sold off on "whisper" expectations (the stock slid despite DC nearly doubling in Q1 FY27). The Aug 26 report is a binary event around Blackwell demand, margins and Rubin timing. Risk Severity: 5.5/10
💰 Financial Scorecard (Q1 FY2027, ended Apr 26, 2026)
Each metric scored 0–10 on strength/quality relative to expectations and trajectory.
# Metric Latest Value Trend Financial Strength
F1 Revenue $81.6B +85% YoY, +20% QoQ, 3rd straight quarter of accelerating YoY growth 9.8
F2 Data Center Revenue $75.2B +92% YoY, +21% QoQ; ~92% of total 9.8
F3 DC Networking $14.8B +199% YoY, +35% QoQ 9.7
F4 Free Cash Flow $48.6B Record; FCF margin ~60% 9.7
F5 Non-GAAP Gross Margin ~75% Mid-70s sustained; guided 75.0% next Q 9.5
F6 Operating Cash Flow $50.3B Up from $27.4B YoY (+84%) 9.5
F7 Operating Margin ~66% Highest in trailing 8 quarters 9.5
F8 Non-GAAP EPS $1.87 +140% YoY 9.4
F9 Next-Q Guidance ~$91.0B ±2% Implies continued sequential acceleration, assumes $0 China 9.3
F10 Capital Returns $0.25 div + $80B buyback Dividend up 25×; huge new authorization 8.8
F11 Balance-Sheet Expansion Inventory $25.8B; commitments $119.0B; opex +52% Rising obligations = quality watch-item 6.5
Financial composite (avg of F1–F11): ~9.2/10 — exceptional top-line, margins and cash generation; the only soft spot is the fast-expanding balance sheet and supply commitments.
🏆 Master Ranking — Catalysts, Financials & Risks Combined
Positive drivers (catalysts + financial strengths) ranked by score. Risks listed separately as deductions.
Rank Driver Type Score (0–10)
1️⃣ 📊 Revenue $81.6B (+85% YoY, accelerating) Financial 9.8
1️⃣ 🏢 Data Center $75.2B (+92% YoY) Financial 9.8
3️⃣ 🌐 DC Networking +199% YoY Financial 9.7
3️⃣ 💵 Free Cash Flow $48.6B (record) Financial 9.7
5️⃣ 🏗️ Blackwell ramp + Rubin transition Catalyst 9.7
6️⃣ 🌐 Data-center dominance & networking moat Catalyst 9.5
6️⃣ 📈 Non-GAAP gross margin ~75% Financial 9.5
6️⃣ 💵 Operating cash flow $50.3B Financial 9.5
6️⃣ ⚙️ Operating margin ~66% Financial 9.5
10️⃣ 🧠 CUDA software moat / full-stack lock-in Catalyst 9.0
10️⃣ 📑 Next-Q guidance ~$91B Financial 9.3
12️⃣ 💵 Capital returns (div + $80B buyback) Catalyst 8.5
13️⃣ 🌍 Sovereign AI + hyperscaler capex supercycle Catalyst 8.5
14️⃣ 🇨🇳 China re-opening (H200, optionality) Catalyst 8.0
15️⃣ 📈 Analyst momentum & estimate revisions Catalyst 7.5
⚠️ Risk Ledger (severity-ranked)
Rank Risk Severity (0–10)
1️⃣ 🫧 AI-bubble / circular-financing thesis 8.5
2️⃣ 💸 Valuation & concentration risk 8.0
3️⃣ 🇨🇳 China policy whiplash + "AI tax" margin drag 7.5
4️⃣ 🥊 Competition (AMD MI400/450, custom silicon) 7.0
5️⃣ 📉 Depreciation / chip-obsolescence accounting 6.5
6️⃣ ⚡ Rising costs, inventory & $119B commitments 6.0
7️⃣ 🔀 Near-term earnings volatility 5.5
📝 Summary Outlook (August 2026)
NVIDIA enters H2 CY2026 as the single most important company in the AI buildout — record $81.6B revenue, Data Center up 92%, ~75% gross margins, and $48.6B of quarterly free cash flow that funds a 25× dividend hike and an $80B buyback. The Blackwell → Rubin cadence plus a 199%-growth networking business and the CUDA moat give it a durable, full-stack lead, and China H200 re-opening is pure optionality not yet in guidance. Analysts remain overwhelmingly bullish (Strong Buy, ~$302 target).
The bear case is no longer about demand — it's about how that demand is financed. Burry, Cuban, the IMF and BIS all point at circular vendor-financing (>$540B in 2026 deals), aggressive depreciation math, and a semiconductor bubble indicator at 0.91. With a ~$5T cap priced for perfection, valuation leaves little room for error, and China policy remains a two-way swing factor.
Bottom line: fundamentals are as strong as any mega-cap in history (financial composite ~9.2/10), but the risk isn't operational execution — it's whether the AI-capex flywheel is self-sustaining or self-referential. The Aug 26 print (Blackwell demand, margins, Rubin timing, any China commentary) is the next decisive catalyst.
Sources: NVIDIA Q1 FY2027 & Q4/Q3 FY2026 press releases and CFO commentary (SEC 8-K, nvidianews.nvidia.com); CNBC, TIKR, StockTitan, S&P Global, IG, Futurum (earnings); Public.com, StockAnalysis, MarketBeat, Finbold/KeyBanc, Watcher.Guru/Bernstein (targets/ratings); TheStreet, Blockonomi, GuruFocus, TradingKey, Yahoo Finance (Burry/Cuban bubble thesis); TechPowerUp, Tom's Hardware, tech-insider (China/H200).
As of August 10, 2026. Stock ~$222–223. Consensus rating Strong Buy (58 of 61 analysts buy/strong-buy); average 12-month price target ~$302–304 (~+47% upside); range $180 (low) → $500 (high). Next earnings ~Aug 26–27, 2026 (Q2 FY2027). Latest reported quarter: Q1 FY2027 (ended Apr 26, 2026) — record revenue $81.6B (+85% YoY), Data Center $75.2B (+92% YoY).
🔑 Key Catalysts Driving NVDA (2026+)
🏗️ Blackwell Ramp + Rubin Transition (the core engine)
Blackwell is the fastest product ramp in NVIDIA's history — GB300 NVL72 demand described as "off the charts," with frontier labs and hyperscalers cumulatively deploying hundreds of thousands of GPUs. Next-gen Vera Rubin is on track for an H2 FY2027 ramp, giving a built-in upgrade cycle. Jensen Huang forecast at GTC 2026 that AI data-center revenue could reach ~$1 trillion by 2027, with ~25% upside beyond that including CPU/systems. Impact Score: 9.7/10
🌐 Data Center Dominance & Networking Explosion
Data Center is ~92% of total revenue ($75.2B in Q1 FY2027). The under-appreciated story is networking: DC networking revenue hit a record $14.8B, up 199% YoY (NVLink scale-up, Spectrum-X Ethernet, Quantum-X InfiniBand). This turns NVIDIA from a chip vendor into a full rack-scale systems supplier and deepens the moat. Impact Score: 9.5/10
🧠 CUDA Software Moat & Full-Stack Lock-In
"NVIDIA is the only platform that runs every frontier AI model" (Huang) — Anthropic, OpenAI, Meta, Google Gemini, xAI. CUDA + the systems stack create switching costs that custom silicon struggles to match, sustaining pricing power and mid-70s gross margins. Impact Score: 9/10
💵 Massive Capital Returns (Dividend + Buyback)
On May 18, 2026 the board raised the quarterly dividend 25× (from $0.01 to $0.25) and added an $80B buyback authorization (no expiration). First nine months of FY2026 already returned $37B to shareholders. Signals management confidence and provides a valuation floor. Impact Score: 8.5/10
🌍 Sovereign AI + Hyperscaler Capex Supercycle
Microsoft, Amazon, Alphabet, Meta, Oracle are guiding to ~$140B+ (some estimates $650–700B across top firms) of AI capex in 2026. Data Center is diversifying beyond hyperscale into AI Clouds, industrial, enterprise and sovereign customers (now ~50% of DC), broadening and de-risking the demand base. Impact Score: 8.5/10
🇨🇳 China Re-Opening (H200 with Revenue-Share)
The Trump administration cleared H200 exports to China under a 15–25% revenue-share ("AI tax") framework with Commerce licensing. China was ~20–25% of DC revenue pre-controls (~$10–15B/yr). Huang says demand is "very high" and hasn't ruled out Blackwell/Rubin for China "in time." Upside optionality not currently baked into guidance (management assumes $0 China DC compute in the outlook). Impact Score: 8/10
📈 Analyst Momentum & Estimate Revisions
Strong Buy consensus; targets clustering $300–330 (KeyBanc $330, Bernstein sees a break above $300). Current-year EPS estimates revised up ~7.8% in 90 days. Positive revision momentum tends to pull in institutional flows. Impact Score: 7.5/10
⚠️ Key Risks & Negative Drivers
🫧 AI-Bubble / Circular-Financing Thesis
The loudest bear case. Michael Burry disclosed sizable NVDA puts (Jul 2026), arguing much demand is vendor-financed and off-balance-sheet, with "future revenues majority financed in a circular arrangement." NVIDIA has announced >$540B of circular-financing deals in 2026 (Bloomberg). BofA's semiconductor Bubble Risk Indicator hit 0.91; IMF and BIS both flagged AI circular financing as a systemic risk. Mark Cuban compared it to the dot-com burst. Risk Severity: 8.5/10
💸 Valuation & Concentration Risk
Multi-trillion-dollar market cap (~$5T) priced for sustained hypergrowth. Magnificent-7 shed >$2.2T in June 2026 alone; NVDA lost ~$250B cap in a single July session on bubble fears. Any guidance wobble → sharp de-rating. Semiconductor ETF (SOXX) trading at ~76× P/E. Risk Severity: 8/10
🇨🇳 China Policy Whiplash & The "AI Tax"
Even with H200 clearance, the 15–25% revenue-share erodes margins, Beijing is reportedly limiting approved buyers, and $0 China DC compute is currently in guidance — a reminder of how fast policy can swing (Q1 FY26 had $4.6B China Hopper; Q1 FY27 had none). Blackwell/Rubin access remains uncertain. Risk Severity: 7.5/10
🥊 Competitive Pressure (AMD + Custom Silicon)
AMD's MI400/MI450 + Helios racks (incl. the Anthropic 2GW deal) are a credible #2, and hyperscaler custom silicon (Google TPU, AWS Trainium, Microsoft Maia) targets the same TAM. Sustained share/margin defense is not guaranteed as buyers seek second sources. Risk Severity: 7/10
📉 Depreciation & Chip-Obsolescence Accounting
Burry's secondary thesis: if AI GPUs have a real 2–3 year useful life, hyperscalers' extended depreciation schedules inflate reported profits and mask deteriorating ROI on AI capex — which could slow the capex supercycle NVIDIA depends on. Risk Severity: 6.5/10
⚡ Rising Costs, Inventory & Commitments
GAAP opex +52% YoY to $7.6B; inventory $25.8B; supply/purchase commitments $119.0B. Aggressive capacity build-out raises execution and write-down risk if demand ever hesitates (the balance-sheet-expansion factor analysts flag). Risk Severity: 6/10
🔀 Near-Term Earnings Volatility
Even blowout prints have sold off on "whisper" expectations (the stock slid despite DC nearly doubling in Q1 FY27). The Aug 26 report is a binary event around Blackwell demand, margins and Rubin timing. Risk Severity: 5.5/10
💰 Financial Scorecard (Q1 FY2027, ended Apr 26, 2026)
Each metric scored 0–10 on strength/quality relative to expectations and trajectory.
# Metric Latest Value Trend Financial Strength
F1 Revenue $81.6B +85% YoY, +20% QoQ, 3rd straight quarter of accelerating YoY growth 9.8
F2 Data Center Revenue $75.2B +92% YoY, +21% QoQ; ~92% of total 9.8
F3 DC Networking $14.8B +199% YoY, +35% QoQ 9.7
F4 Free Cash Flow $48.6B Record; FCF margin ~60% 9.7
F5 Non-GAAP Gross Margin ~75% Mid-70s sustained; guided 75.0% next Q 9.5
F6 Operating Cash Flow $50.3B Up from $27.4B YoY (+84%) 9.5
F7 Operating Margin ~66% Highest in trailing 8 quarters 9.5
F8 Non-GAAP EPS $1.87 +140% YoY 9.4
F9 Next-Q Guidance ~$91.0B ±2% Implies continued sequential acceleration, assumes $0 China 9.3
F10 Capital Returns $0.25 div + $80B buyback Dividend up 25×; huge new authorization 8.8
F11 Balance-Sheet Expansion Inventory $25.8B; commitments $119.0B; opex +52% Rising obligations = quality watch-item 6.5
Financial composite (avg of F1–F11): ~9.2/10 — exceptional top-line, margins and cash generation; the only soft spot is the fast-expanding balance sheet and supply commitments.
🏆 Master Ranking — Catalysts, Financials & Risks Combined
Positive drivers (catalysts + financial strengths) ranked by score. Risks listed separately as deductions.
Rank Driver Type Score (0–10)
1️⃣ 📊 Revenue $81.6B (+85% YoY, accelerating) Financial 9.8
1️⃣ 🏢 Data Center $75.2B (+92% YoY) Financial 9.8
3️⃣ 🌐 DC Networking +199% YoY Financial 9.7
3️⃣ 💵 Free Cash Flow $48.6B (record) Financial 9.7
5️⃣ 🏗️ Blackwell ramp + Rubin transition Catalyst 9.7
6️⃣ 🌐 Data-center dominance & networking moat Catalyst 9.5
6️⃣ 📈 Non-GAAP gross margin ~75% Financial 9.5
6️⃣ 💵 Operating cash flow $50.3B Financial 9.5
6️⃣ ⚙️ Operating margin ~66% Financial 9.5
10️⃣ 🧠 CUDA software moat / full-stack lock-in Catalyst 9.0
10️⃣ 📑 Next-Q guidance ~$91B Financial 9.3
12️⃣ 💵 Capital returns (div + $80B buyback) Catalyst 8.5
13️⃣ 🌍 Sovereign AI + hyperscaler capex supercycle Catalyst 8.5
14️⃣ 🇨🇳 China re-opening (H200, optionality) Catalyst 8.0
15️⃣ 📈 Analyst momentum & estimate revisions Catalyst 7.5
⚠️ Risk Ledger (severity-ranked)
Rank Risk Severity (0–10)
1️⃣ 🫧 AI-bubble / circular-financing thesis 8.5
2️⃣ 💸 Valuation & concentration risk 8.0
3️⃣ 🇨🇳 China policy whiplash + "AI tax" margin drag 7.5
4️⃣ 🥊 Competition (AMD MI400/450, custom silicon) 7.0
5️⃣ 📉 Depreciation / chip-obsolescence accounting 6.5
6️⃣ ⚡ Rising costs, inventory & $119B commitments 6.0
7️⃣ 🔀 Near-term earnings volatility 5.5
📝 Summary Outlook (August 2026)
NVIDIA enters H2 CY2026 as the single most important company in the AI buildout — record $81.6B revenue, Data Center up 92%, ~75% gross margins, and $48.6B of quarterly free cash flow that funds a 25× dividend hike and an $80B buyback. The Blackwell → Rubin cadence plus a 199%-growth networking business and the CUDA moat give it a durable, full-stack lead, and China H200 re-opening is pure optionality not yet in guidance. Analysts remain overwhelmingly bullish (Strong Buy, ~$302 target).
The bear case is no longer about demand — it's about how that demand is financed. Burry, Cuban, the IMF and BIS all point at circular vendor-financing (>$540B in 2026 deals), aggressive depreciation math, and a semiconductor bubble indicator at 0.91. With a ~$5T cap priced for perfection, valuation leaves little room for error, and China policy remains a two-way swing factor.
Bottom line: fundamentals are as strong as any mega-cap in history (financial composite ~9.2/10), but the risk isn't operational execution — it's whether the AI-capex flywheel is self-sustaining or self-referential. The Aug 26 print (Blackwell demand, margins, Rubin timing, any China commentary) is the next decisive catalyst.
Sources: NVIDIA Q1 FY2027 & Q4/Q3 FY2026 press releases and CFO commentary (SEC 8-K, nvidianews.nvidia.com); CNBC, TIKR, StockTitan, S&P Global, IG, Futurum (earnings); Public.com, StockAnalysis, MarketBeat, Finbold/KeyBanc, Watcher.Guru/Bernstein (targets/ratings); TheStreet, Blockonomi, GuruFocus, TradingKey, Yahoo Finance (Burry/Cuban bubble thesis); TechPowerUp, Tom's Hardware, tech-insider (China/H200).
Nota
Eli Lilly LLY 2026+ Catalysts & Risks Institutional Overview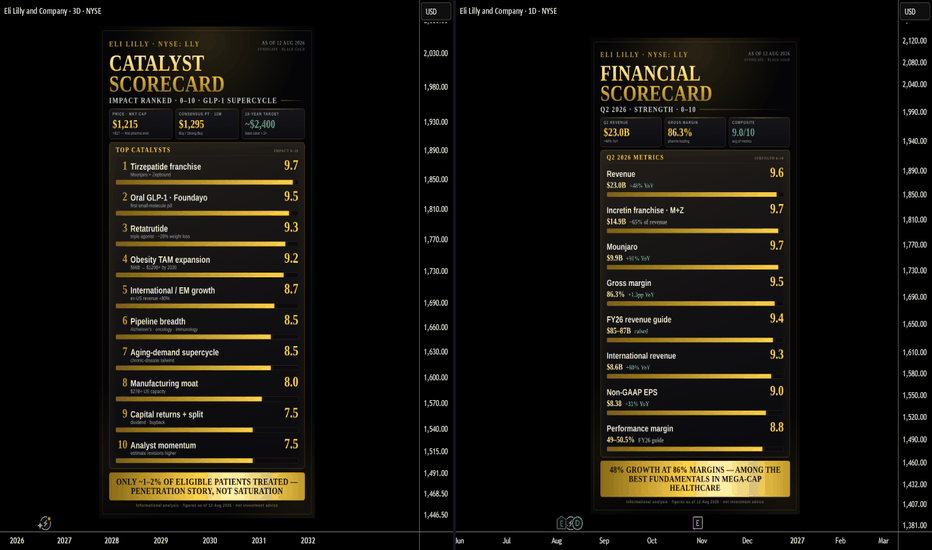
Nota
Strong Reclaim Zones | ProjectSyndicate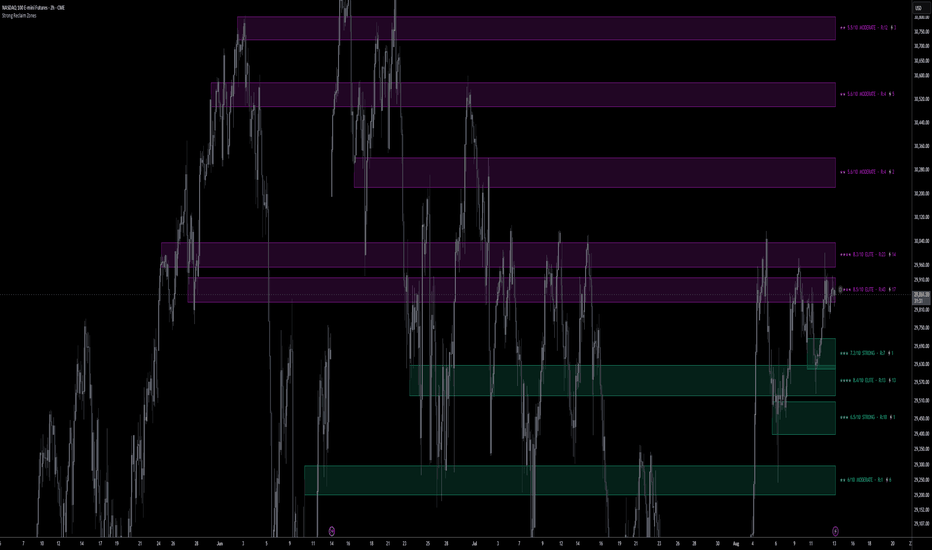
Nota
ES H4 Institutional Liquidity Levels Bulls/Bears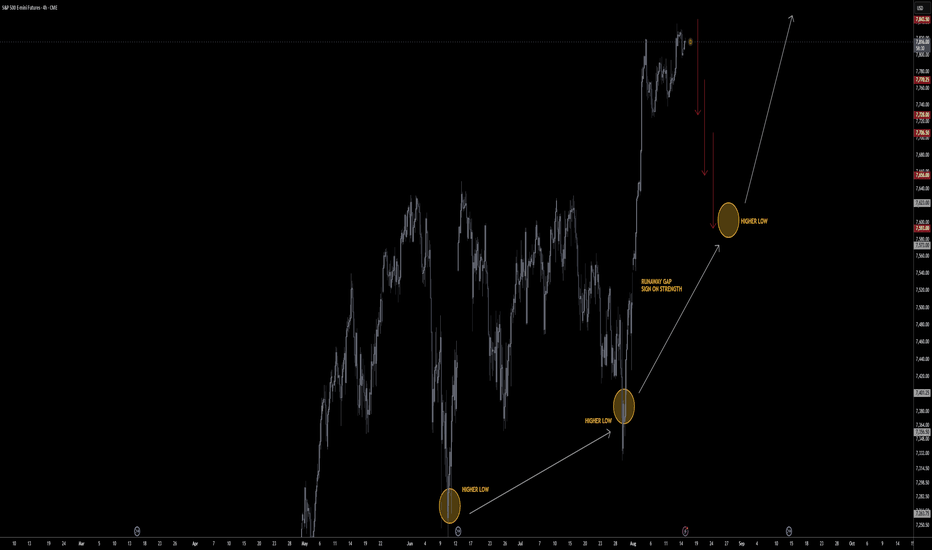
Nota
SpaceX (SPCX) 2026+ Catalysts & Risks Institutional Overview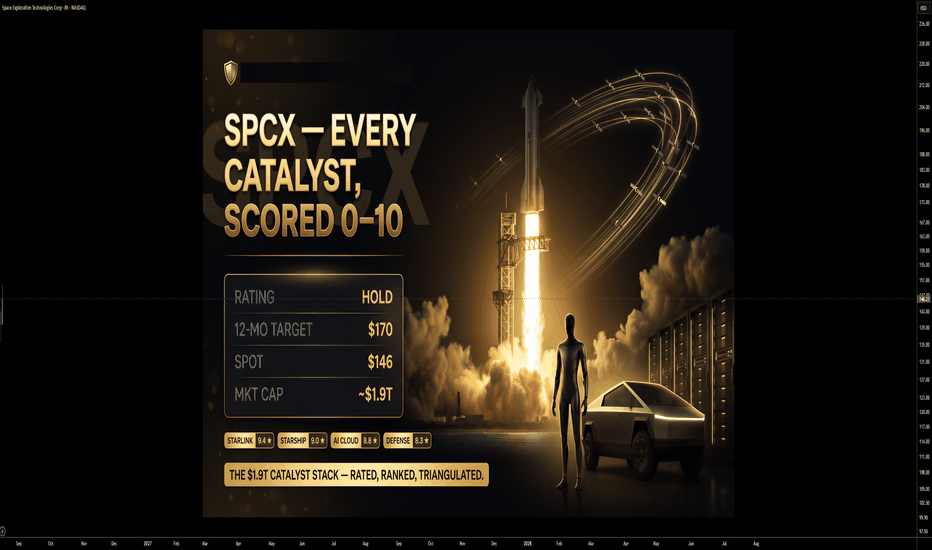
Trade fechado: objetivo atingido
Nota
Strong ORB Matrix | ProjectSyndicate
Nota
Strong Volume Map | ProjectSyndicate
Nota
Strong Risk Heatmap Terminal | ProjectSyndicate
Nota
Strong Prop Sim 2.0 | ProjectSyndicate
Nota
Strong Stop Loss Heatmaps | ProjectSyndicate
Nota
Strong Gold Terminal | ProjectSyndicate

Gold Algo Trading · +1100% YTD · max DD <5%
Syndicate Ultimate · 5 algo systems · 1 bundle
1 payment · lifetime access · no monthly fees
+ FX · NQ/ES · 10+ yr institutional desk
syndicate001.com
Join on Telegram
t.me/aisyndicate001
Syndicate Ultimate · 5 algo systems · 1 bundle
1 payment · lifetime access · no monthly fees
+ FX · NQ/ES · 10+ yr institutional desk
syndicate001.com
Join on Telegram
t.me/aisyndicate001
Publicações relacionadas
Aviso legal
As informações e publicações não se destinam a ser, e não constituem, conselhos ou recomendações financeiras, de investimento, comerciais ou de outro tipo fornecidos ou endossados pela TradingView. Leia mais nos Termos de Uso.
Gold Algo Trading · +1100% YTD · max DD <5%
Syndicate Ultimate · 5 algo systems · 1 bundle
1 payment · lifetime access · no monthly fees
+ FX · NQ/ES · 10+ yr institutional desk
syndicate001.com
Join on Telegram
t.me/aisyndicate001
Syndicate Ultimate · 5 algo systems · 1 bundle
1 payment · lifetime access · no monthly fees
+ FX · NQ/ES · 10+ yr institutional desk
syndicate001.com
Join on Telegram
t.me/aisyndicate001
Publicações relacionadas
Aviso legal
As informações e publicações não se destinam a ser, e não constituem, conselhos ou recomendações financeiras, de investimento, comerciais ou de outro tipo fornecidos ou endossados pela TradingView. Leia mais nos Termos de Uso.