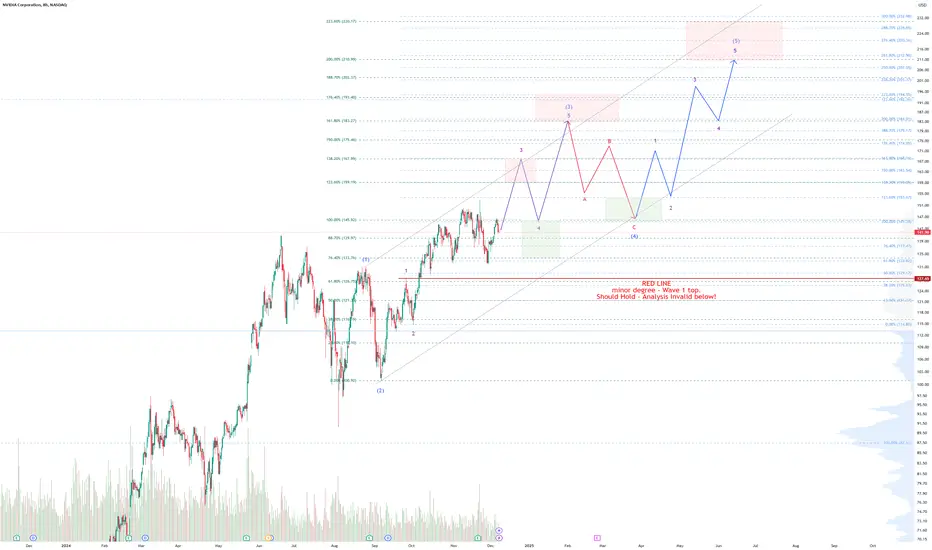
In this short piece, I present some visuals of my ideas on  NVDA targets.
If the chart patterns play well then my intention is to exit at around $183 to $193 and then catch the wave (4) low ideally at $146, for the final push up in this sequence in to $210 or slightly higher for a final exit.
Viewed from the perspective of a weekly or monthly chart -NVDA doesn't look complete at those higher levels, however, I suspect that the end in to the wave (5) around $210 will complete a multitude of larger wave degrees, thus start a much larger degree (wave 4) correction from that point.
**NVDA may be a strong barometer for the market peak on an intermediate scale. I will certainly consider this strongly.
NVDA targets. If the chart patterns play well then my intention is to exit at around $183 to $193 and then catch the wave (4) low ideally at $146, for the final push up in this sequence in to $210 or slightly higher for a final exit.
Viewed from the perspective of a weekly or monthly chart -
NVDA doesn't look complete at those higher levels, however, I suspect that the end in to the wave (5) around $210 will complete a multitude of larger wave degrees, thus start a much larger degree (wave 4) correction from that point.**NVDA may be a strong barometer for the market peak on an intermediate scale. I will certainly consider this strongly.

Student of the market since 2011. Technical analyst using some fundamentals, Elliott Wave Analysis, Volume Profiling, Supply & Demand and 'Flow' - my own indicator.
Publicações relacionadas
Aviso legal
As informações e publicações não se destinam a ser, e não constituem, conselhos ou recomendações financeiras, de investimento, comerciais ou de outro tipo fornecidos ou endossados pela TradingView. Leia mais nos Termos de Uso.
Student of the market since 2011. Technical analyst using some fundamentals, Elliott Wave Analysis, Volume Profiling, Supply & Demand and 'Flow' - my own indicator.
Publicações relacionadas
Aviso legal
As informações e publicações não se destinam a ser, e não constituem, conselhos ou recomendações financeiras, de investimento, comerciais ou de outro tipo fornecidos ou endossados pela TradingView. Leia mais nos Termos de Uso.