
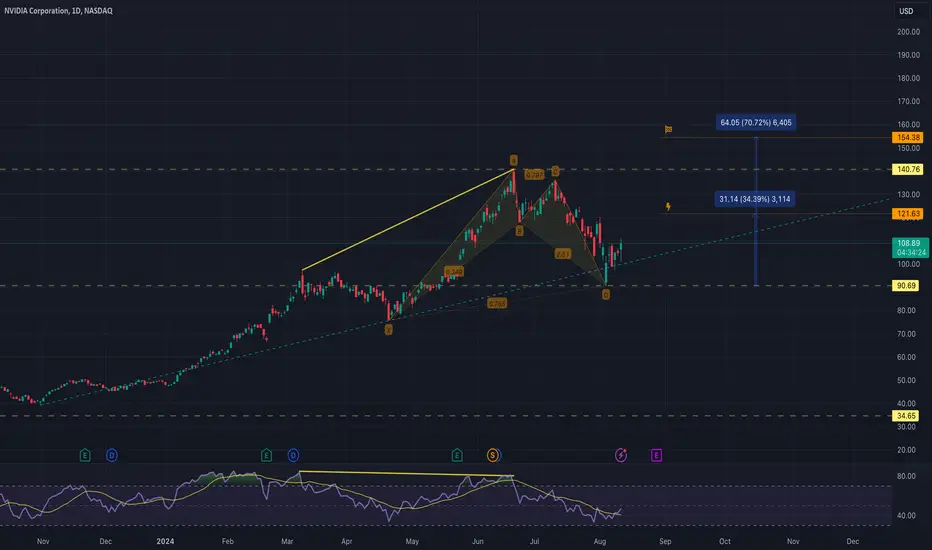
#Nvda 1D chart;
Continues its 8-month steady rise from the beginning of the year to today
It had given the first bearish signal with its divergence in the $140 zone, which is the Ath level.
As of the $90 level, the bullish pattern started and the target points are as in the chart.
Continues its 8-month steady rise from the beginning of the year to today
It had given the first bearish signal with its divergence in the $140 zone, which is the Ath level.
As of the $90 level, the bullish pattern started and the target points are as in the chart.

For more you can follow me on X. @UgurTash
Aviso legal
As informações e publicações não se destinam a ser, e não constituem, conselhos ou recomendações financeiras, de investimento, comerciais ou de outro tipo fornecidos ou endossados pela TradingView. Leia mais nos Termos de Uso.
For more you can follow me on X. @UgurTash
Aviso legal
As informações e publicações não se destinam a ser, e não constituem, conselhos ou recomendações financeiras, de investimento, comerciais ou de outro tipo fornecidos ou endossados pela TradingView. Leia mais nos Termos de Uso.