
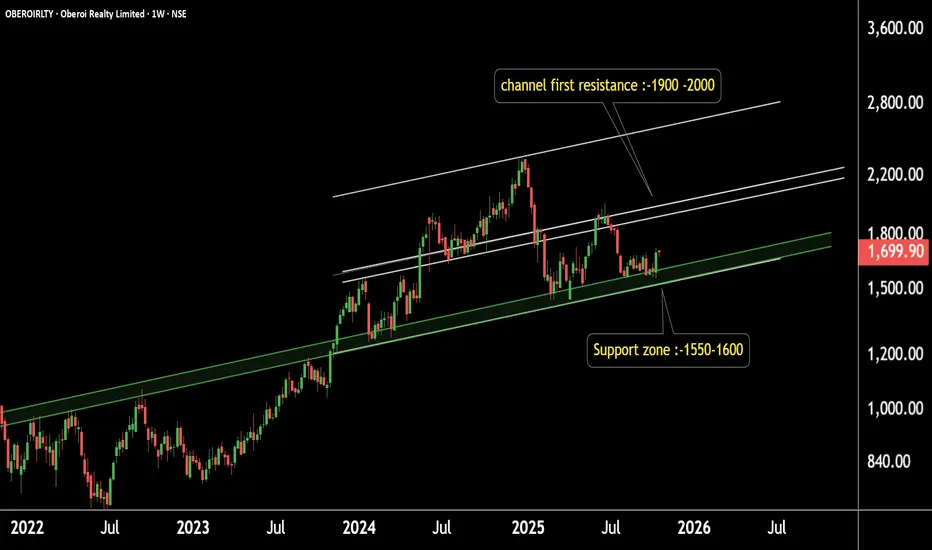
Oberoi Realty – Daily Timeframe Analysis
Oberoi Realty is currently trading near a strong long-term support zone in the ₹1,500–₹1,600 range.
Timeframe: Daily
Support Zone: ₹1,500–₹1,600
Resistance (Channel Mid-Boundary): ₹1,900–₹2,000
Structure: The stock is moving within a well-defined parallel channel, respecting its trend boundaries over time.
If the support zone holds, a potential upside towards the upper channel levels can be expected — indicating possible bullish momentum ahead.
Thank you!
Oberoi Realty is currently trading near a strong long-term support zone in the ₹1,500–₹1,600 range.
Timeframe: Daily
Support Zone: ₹1,500–₹1,600
Resistance (Channel Mid-Boundary): ₹1,900–₹2,000
Structure: The stock is moving within a well-defined parallel channel, respecting its trend boundaries over time.
If the support zone holds, a potential upside towards the upper channel levels can be expected — indicating possible bullish momentum ahead.
Thank you!

@RahulSarawagi
Connect us at optionlab.co.in/
Connect us at optionlab.co.in/
Aviso legal
As informações e publicações não se destinam a ser, e não constituem, conselhos ou recomendações financeiras, de investimento, comerciais ou de outro tipo fornecidos ou endossados pela TradingView. Leia mais nos Termos de Uso.
@RahulSarawagi
Connect us at optionlab.co.in/
Connect us at optionlab.co.in/
Aviso legal
As informações e publicações não se destinam a ser, e não constituem, conselhos ou recomendações financeiras, de investimento, comerciais ou de outro tipo fornecidos ou endossados pela TradingView. Leia mais nos Termos de Uso.