Ocean chart analysis
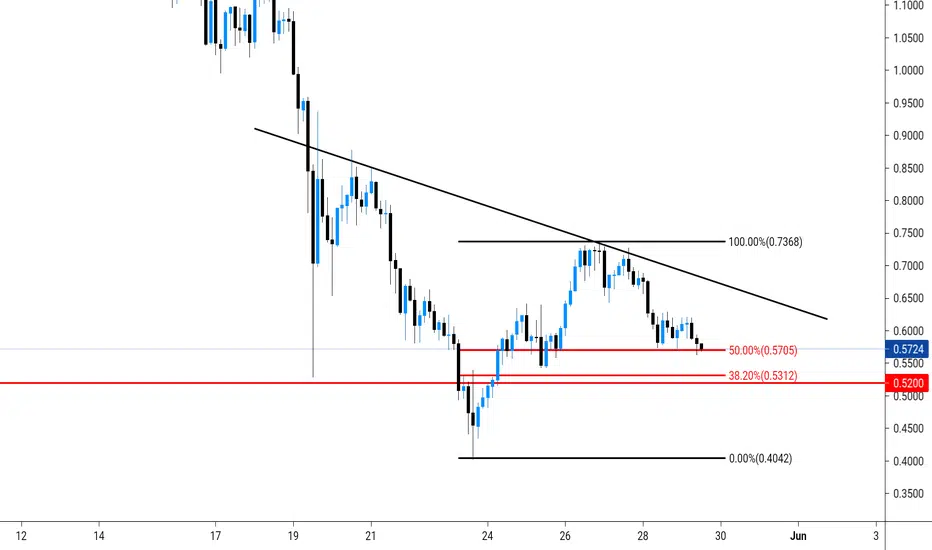
#OCEAN 3H USDT CHART ANALYSIS...
Ocean Now Just Above It's Weekly Strong Support Zone. If It's Can't Hold This Level, It Will Be More Bad For Ocean. So Weekly Candle Should Be Close Above Thid Support Zone 0.52$. On The Other Side It's Creating A Inverse Head & Shoulder Pattern. You Can Buy After Breakout The Neckline.
Short Term Trader Always Stop-loss. Invest How Much You Can Afford To Loss. Always Verify Your Own Analysis.
Ocean Now Just Above It's Weekly Strong Support Zone. If It's Can't Hold This Level, It Will Be More Bad For Ocean. So Weekly Candle Should Be Close Above Thid Support Zone 0.52$. On The Other Side It's Creating A Inverse Head & Shoulder Pattern. You Can Buy After Breakout The Neckline.
Short Term Trader Always Stop-loss. Invest How Much You Can Afford To Loss. Always Verify Your Own Analysis.

Aviso legal
As informações e publicações não se destinam a ser, e não constituem, conselhos ou recomendações financeiras, de investimento, comerciais ou de outro tipo fornecidos ou endossados pela TradingView. Leia mais nos Termos de Uso.
Aviso legal
As informações e publicações não se destinam a ser, e não constituem, conselhos ou recomendações financeiras, de investimento, comerciais ou de outro tipo fornecidos ou endossados pela TradingView. Leia mais nos Termos de Uso.