
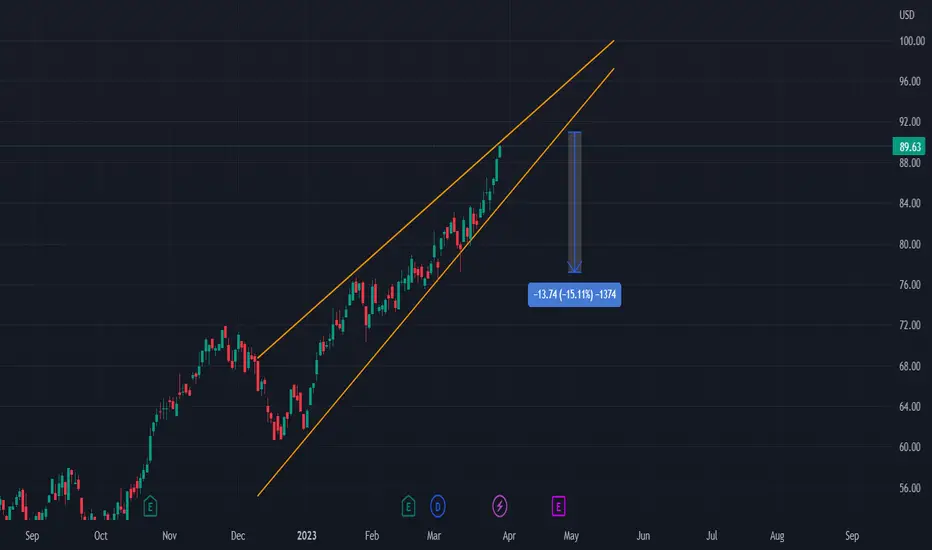
On the chart, we can see a rising wedge occurring.
OMAB is at its 52-week high, and this has been formed as a rising wedge.
We therefore expect it to have a drop to the downside.
Entry will be at the breakout of the wedge with a possible ROI of 15%
More details are shown on the chart.
OMAB is at its 52-week high, and this has been formed as a rising wedge.
We therefore expect it to have a drop to the downside.
Entry will be at the breakout of the wedge with a possible ROI of 15%
More details are shown on the chart.
Trade fechado: objetivo atingido
Played out as expected. Closing here as target reached almost.Nota
Next Short may be entered on the retest of the upsloping resistance (previous support)Nota
have bounced
💥 Free signals and ideas ➡ t.me/vfinvestment
Publicações relacionadas
Aviso legal
As informações e publicações não se destinam a ser, e não constituem, conselhos ou recomendações financeiras, de investimento, comerciais ou de outro tipo fornecidos ou endossados pela TradingView. Leia mais nos Termos de Uso.
💥 Free signals and ideas ➡ t.me/vfinvestment
Publicações relacionadas
Aviso legal
As informações e publicações não se destinam a ser, e não constituem, conselhos ou recomendações financeiras, de investimento, comerciais ou de outro tipo fornecidos ou endossados pela TradingView. Leia mais nos Termos de Uso.