Long
OMG Bullish Trading Range
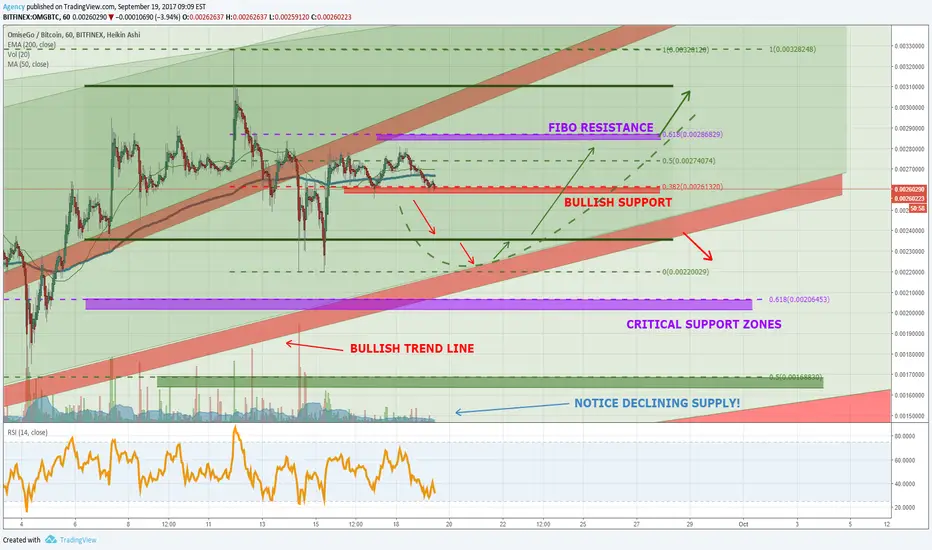
This asset has held up very well over the last few turbulent weeks. If we take a look at the chart data, we can see the trading range is quite defined and its clear where institutional accumulation is taking place. What we want to do now is look for bullish divergence to the upside, and get involved once we see a change in market structure. OR, we can get a little riskier (which comes with more reward) by getting involved if we spring test the bottom trading range again. One of the most interesting things taking place on this chart is the declining supply (volume) evident over the last couple days. I take this as evidence of impending markup, which is usually followed by increasing volume at the break-out to keep gains in check.
As for the USD value of this asset, please see my OMGUSD posts. The pattern is different, but there is also a clear trading range in that chart. However, the USD value of OMG is dependent on what occurs in the BTCUSD chart, so its important to keep the latter pair in mind.
As for the USD value of this asset, please see my OMGUSD posts. The pattern is different, but there is also a clear trading range in that chart. However, the USD value of OMG is dependent on what occurs in the BTCUSD chart, so its important to keep the latter pair in mind.
Nota
Approaching the uptrend line along with the bottom of the trading range.Nota
Reversal confirmation line.Nota
The uptrend line is broken :( We are at the trading range support level. Based on 1HR RSI we could bounce here and go up. If we break below, the major fibo support is next. Im not happy about the trend line break... this means we are likely to break it again.
Nota
Got over that confirmation line... but the price action is pretty weak.Nota
Rising wedge (reversal pattern) on RSI and price action. No bearish divergence yet, but we are seeing weakness.Nota
No bearish divergences in the RSI. Key fibo resistance above tho. This will keep offer the OMGUSD chart some stability against upcoming loss in the BTCUSD.Nota
To give a little more analysis on whats up: We reached just above the sub-sub fibo level (broken purple line) and just below the key fibo resistance. This is a bearish. There is another uptrend line we can draw now (its on our updated chart). Just to remind you, if we get losses here, we will see this in the OMGUSD chart. IF we get further loss in the BTCUSD chart, that will compound the loss in the OMGUSD chart.Nota
We never got over the key fibo :(Nota
New OMGUSD thread: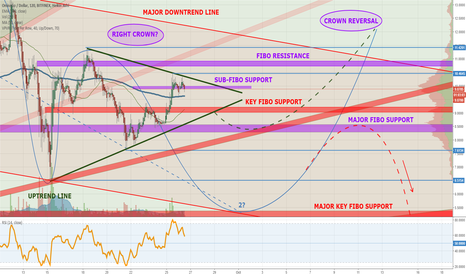
Nota
OK, so we can explain the sluggishness in the OMGUSD chart based on things going on here in the OMGBTC chart:Note the sub-key fibo support and that we are at the uptrend line again.
Nota
We are still technically in the shorting area. We have some new lines:Nota
We have been trading below the uptrend line for a little while now, so a new chart will be made later.
Publicações relacionadas
Aviso legal
As informações e publicações não se destinam a ser, e não constituem, conselhos ou recomendações financeiras, de investimento, comerciais ou de outro tipo fornecidos ou endossados pela TradingView. Leia mais nos Termos de Uso.
Publicações relacionadas
Aviso legal
As informações e publicações não se destinam a ser, e não constituem, conselhos ou recomendações financeiras, de investimento, comerciais ou de outro tipo fornecidos ou endossados pela TradingView. Leia mais nos Termos de Uso.