Have you kids taken a look at Oracle  ORCL recently? The tech giant had a strong few months this past spring -- rising more than 80% between its April low and June high -- then stumbled.
Let's see what its chart and fundamentals say could happen next.
Oracle's Fundamental Analysis
Oracle gained 86% over some seven weeks to a $250.25 intraday high on June 1 after trading as low as $134.27 on April 10.
But the stock has fallen about 25% since then -- and has had a very rough nine months or so if one takes a look at a longer time frame.
Perhaps the reason why is the company's fundamentals.
Yes, Oracle last week beat analyst estimates for its fiscal Q4 revenues and earnings -- but true analysis requires a look under the hood.
A dive into ORCL's latest numbers shows that the company generated $31.997 billion of operating cash flow during fiscal Q4 but spent $55.663 billion on capital expenditures.
That leaves free cash flow of minus $23.686 billion. That's not a typo -- Oracle spent much more on capex than it received in operating cash flow. In fact, this was the firm's fifth consecutive quarter of such a cash burn.
Turning to Oracle's fiscal Q4 balance sheet, the company ended the period with a $31.894 billion cash position and $46.567 billion of total current assets.
However, current liabilities added up to $41.764 billion, including $7.199 billion of short-term debt load and $9.916 billion of deferred revenues.
This gave Oracle a 1.12 current ratio. Many investors would say that's OK, but not "good."
Adjusted to exclude deferred revenues (which aren't really true liabilities), this ratio rises to 1.31. While that might pass muster with many market watchers, no competent CFO would brag about such a number.
Meanwhile, Oracle's total assets amounted to $261.759 billion at fiscal Q4's May 31 ending. Of that number, goodwill or other intangibles accounted for less than 24% -- which isn't outlandish in 2026.
That said, Oracle's total liabilities less equity came in at $218.703 billion. And of that total, the company's long-term debt load works out to $122.342 billion.
Oracle's negative free cash flow means the company is burning cash even as its debt load keeps growing.
True, Oracle boasted in last week's quarterly report that it has $638 billion of remaining performance obligations. But if that's so, how are there only $9.9 billion in deferred revenues on the balance sheet's liability side?
It's been said that OpenAI accounts for more than 50% of that order backlog. If OpenAI isn't putting any cash down on those upcoming purchases, are they truly reliable orders?
Oracle's Technical Analysis
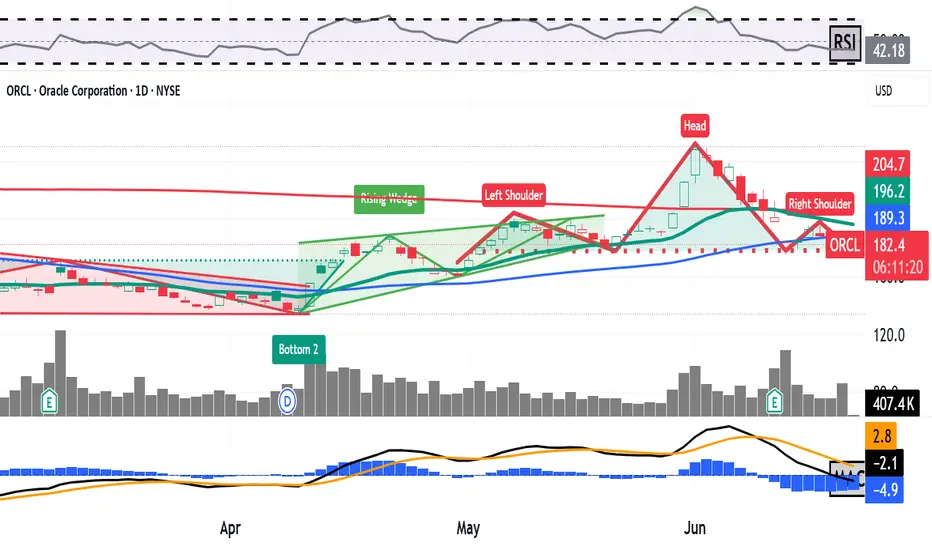
Next, let's check out ORCL's chart going back some three months and running through Tuesday afternoon (June 17):

Readers will first see that Oracle faced a bearish rising-wedge pattern this past spring that later morphed into a head-and-shoulders pattern of bearish reversal.
Marked with green shading at the chart's right, this head-and-shoulders bears a $178 apparent pivot point. (ORCL was trading at $182.67 Monday morning.)
However, Oracle has already lost its 200-day Simple Moving Average (or "SMA"), marked with a red line at $205.40 in the above chart. Shares have also given up their 21-day Exponential Moving Average (or "EMA"), denoted by a green line at $200.50.
And as I write this, the stock is currently fighting to hold onto its 50-day SMA (the blue line at $186.80). Definitively losing that line could very well force some portfolio managers who have hung on to this point to consider exiting or reducing their long positions.
As for the other technical indicators above, Oracle's Relative Strength Index (the gray line marked "RSI" at the chart's top) is below neutral.
Similarly, the stock's daily Moving Average Convergence Divergence indicator (or "MACD," denoted by blue bars, a black line and a gold line at the chart's bottom) is postured quite negatively.
The histogram of the 9-day EMA (the blue bars) is deeply negative, while the 12-day EMA (the black line) is running well below the 26-day EMA (the gold line). All of those are bearish signals.
(Moomoo Technologies Inc. Markets Commentator Stephen "Sarge" Guilfoyle had no position in ORCL at the time of writing this column.)
This article discusses technical analysis, other approaches, including fundamental analysis, may offer very different views. The examples provided are for illustrative purposes only and are not intended to be reflective of the results you can expect to achieve. Specific security charts used are for illustrative purposes only and are not a recommendation, offer to sell, or a solicitation of an offer to buy any security. Past investment performance does not indicate or guarantee future success. Returns will vary, and all investments carry risks, including loss of principal. This content is also not a research report and is not intended to serve as the basis for any investment decision. The information contained in this article does not purport to be a complete description of the securities, markets, or developments referred to in this material. Moomoo and its affiliates make no representation or warranty as to the article's adequacy, completeness, accuracy or timeliness for any particular purpose of the above content. Furthermore, there is no guarantee that any statements, estimates, price targets, opinions or forecasts provided herein will prove to be correct.
Moomoo is a financial information and trading app offered by Moomoo Technologies Inc. In the U.S., investment products and services on Moomoo are offered by Moomoo Financial Inc., Member FINRA/SIPC.
TradingView is an independent third party not affiliated with Moomoo Financial Inc., Moomoo Technologies Inc., or its affiliates. Moomoo Financial Inc. and its affiliates do not endorse, represent or warrant the completeness and accuracy of the data and information available on the TradingView platform and are not responsible for any services provided by the third-party platform.
ORCL recently? The tech giant had a strong few months this past spring -- rising more than 80% between its April low and June high -- then stumbled. Let's see what its chart and fundamentals say could happen next.
Oracle's Fundamental Analysis
Oracle gained 86% over some seven weeks to a $250.25 intraday high on June 1 after trading as low as $134.27 on April 10.
But the stock has fallen about 25% since then -- and has had a very rough nine months or so if one takes a look at a longer time frame.
Perhaps the reason why is the company's fundamentals.
Yes, Oracle last week beat analyst estimates for its fiscal Q4 revenues and earnings -- but true analysis requires a look under the hood.
A dive into ORCL's latest numbers shows that the company generated $31.997 billion of operating cash flow during fiscal Q4 but spent $55.663 billion on capital expenditures.
That leaves free cash flow of minus $23.686 billion. That's not a typo -- Oracle spent much more on capex than it received in operating cash flow. In fact, this was the firm's fifth consecutive quarter of such a cash burn.
Turning to Oracle's fiscal Q4 balance sheet, the company ended the period with a $31.894 billion cash position and $46.567 billion of total current assets.
However, current liabilities added up to $41.764 billion, including $7.199 billion of short-term debt load and $9.916 billion of deferred revenues.
This gave Oracle a 1.12 current ratio. Many investors would say that's OK, but not "good."
Adjusted to exclude deferred revenues (which aren't really true liabilities), this ratio rises to 1.31. While that might pass muster with many market watchers, no competent CFO would brag about such a number.
Meanwhile, Oracle's total assets amounted to $261.759 billion at fiscal Q4's May 31 ending. Of that number, goodwill or other intangibles accounted for less than 24% -- which isn't outlandish in 2026.
That said, Oracle's total liabilities less equity came in at $218.703 billion. And of that total, the company's long-term debt load works out to $122.342 billion.
Oracle's negative free cash flow means the company is burning cash even as its debt load keeps growing.
True, Oracle boasted in last week's quarterly report that it has $638 billion of remaining performance obligations. But if that's so, how are there only $9.9 billion in deferred revenues on the balance sheet's liability side?
It's been said that OpenAI accounts for more than 50% of that order backlog. If OpenAI isn't putting any cash down on those upcoming purchases, are they truly reliable orders?
Oracle's Technical Analysis
Next, let's check out ORCL's chart going back some three months and running through Tuesday afternoon (June 17):
Readers will first see that Oracle faced a bearish rising-wedge pattern this past spring that later morphed into a head-and-shoulders pattern of bearish reversal.
Marked with green shading at the chart's right, this head-and-shoulders bears a $178 apparent pivot point. (ORCL was trading at $182.67 Monday morning.)
However, Oracle has already lost its 200-day Simple Moving Average (or "SMA"), marked with a red line at $205.40 in the above chart. Shares have also given up their 21-day Exponential Moving Average (or "EMA"), denoted by a green line at $200.50.
And as I write this, the stock is currently fighting to hold onto its 50-day SMA (the blue line at $186.80). Definitively losing that line could very well force some portfolio managers who have hung on to this point to consider exiting or reducing their long positions.
As for the other technical indicators above, Oracle's Relative Strength Index (the gray line marked "RSI" at the chart's top) is below neutral.
Similarly, the stock's daily Moving Average Convergence Divergence indicator (or "MACD," denoted by blue bars, a black line and a gold line at the chart's bottom) is postured quite negatively.
The histogram of the 9-day EMA (the blue bars) is deeply negative, while the 12-day EMA (the black line) is running well below the 26-day EMA (the gold line). All of those are bearish signals.
(Moomoo Technologies Inc. Markets Commentator Stephen "Sarge" Guilfoyle had no position in ORCL at the time of writing this column.)
This article discusses technical analysis, other approaches, including fundamental analysis, may offer very different views. The examples provided are for illustrative purposes only and are not intended to be reflective of the results you can expect to achieve. Specific security charts used are for illustrative purposes only and are not a recommendation, offer to sell, or a solicitation of an offer to buy any security. Past investment performance does not indicate or guarantee future success. Returns will vary, and all investments carry risks, including loss of principal. This content is also not a research report and is not intended to serve as the basis for any investment decision. The information contained in this article does not purport to be a complete description of the securities, markets, or developments referred to in this material. Moomoo and its affiliates make no representation or warranty as to the article's adequacy, completeness, accuracy or timeliness for any particular purpose of the above content. Furthermore, there is no guarantee that any statements, estimates, price targets, opinions or forecasts provided herein will prove to be correct.
Moomoo is a financial information and trading app offered by Moomoo Technologies Inc. In the U.S., investment products and services on Moomoo are offered by Moomoo Financial Inc., Member FINRA/SIPC.
TradingView is an independent third party not affiliated with Moomoo Financial Inc., Moomoo Technologies Inc., or its affiliates. Moomoo Financial Inc. and its affiliates do not endorse, represent or warrant the completeness and accuracy of the data and information available on the TradingView platform and are not responsible for any services provided by the third-party platform.

Aviso legal
As informações e publicações não se destinam a ser, e não constituem, conselhos ou recomendações financeiras, de investimento, comerciais ou de outro tipo fornecidos ou endossados pela TradingView. Leia mais nos Termos de Uso.
Aviso legal
As informações e publicações não se destinam a ser, e não constituem, conselhos ou recomendações financeiras, de investimento, comerciais ou de outro tipo fornecidos ou endossados pela TradingView. Leia mais nos Termos de Uso.