Executive Summary:
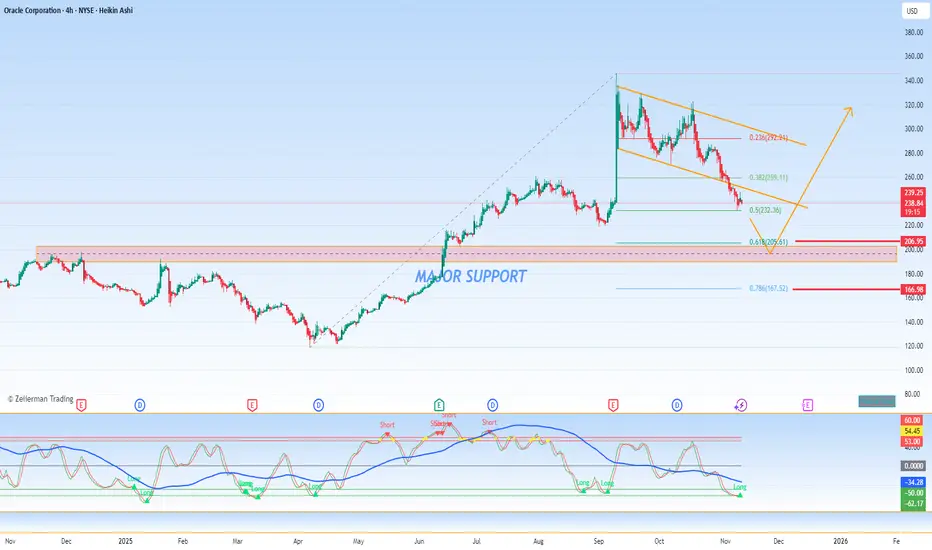
Oracle Corporation ( ORCL) has experienced a significant bearish catalyst following its earnings report on Tuesday, September 9th, leading to a pronounced breakdown of its previous technical structure. The violation of a key Bull Flag pattern has invalidated the prior consolidation's bullish implications and suggests a new near-term downtrend is now in force. In this context, our strategy shifts to identifying strategic support levels for potential capital allocation once the selling pressure subsides. Key Fibonacci retracement levels at $205.61 and $167.52 provide initial targets, while the major psychological support at $200.00 presents a high-conviction buying zone where long-term value and technical support are expected to converge.
Detailed Technical Breakdown:
1. The Catalytic Event and Pattern Breakdown:
The bearish gap down and subsequent sell-off post-earnings on September 9th represent a fundamental shift in market sentiment. This event acted as the decisive catalyst that shattered the technical picture.
Bull Flag Failure: The pattern that was previously interpreted as a Bull Flag—a typically bullish continuation signal—has now been conclusively broken to the downside. Instead of pausing before a move higher, the pattern has failed, indicating that the underlying supply (sellers) has overwhelmed demand (buyers). This breakdown signals that the path of least resistance has shifted downward, and the pattern's prior support level has now become a new resistance zone.
2. Revised Support Framework and Downside Targets:
Given the newly established downtrend, we utilize Fibonacci retracement levels of the stock's major prior upward swing to identify logical areas where the decline may find footing and buyer interest may return.
Initial Support (Shallow Retracement): 61.8% Fibonacci Level at $205.61
This level, known as the "Golden Ratio," is a deep but common retracement zone in a strong stock. A hold here would suggest that the long-term uptrend remains structurally sound despite the recent earnings-driven setback. However, given the magnitude of the breakdown, a mere bounce at this level may be temporary.
Secondary Support (Deep Retracement): 78.6% Fibonacci Level at $167.52
A retracement to this depth would indicate a more severe correction is underway, potentially shaking out weaker hands. While this suggests greater near-term weakness, it also represents a more significant "washout" level that could create a powerful long-term base and a higher-risk, higher-reward entry point.
3. The High-Conviction Value Zone: The $200.00 Psychological Support
Beyond the Fibonacci calculations, the $200.00 threshold stands as a critical major support. This round number carries immense psychological weight and often serves as a magnet for price action and a focal point for institutional buyers. The convergence of this major psychological level with the deep 61.8% Fibonacci retracement in the $205-$200 range creates a high-probability zone for a substantial buyer response.
Strategic Outlook & Scenario Planning:
Bearish Scenario (Immediate): The near-term momentum is bearish. Rallies are likely to be sold into, with the broken Bull Flag pattern (now resistance) capping any upward movements. The initial downside target is the $205.61 support zone.
Accumulation Scenario (Strategic): Our primary interest lies in the $205-$200 support band. A stabilization and reversal from this area, particularly on bullish volume patterns, would signal that the corrective phase may be complete and offer a compelling opportunity to establish or add to a position. A further decline toward the $167.52 level would represent a steeper de-valuation but would require a reassessment of the fundamental thesis.
In conclusion, while the breakdown is unequivocally bearish in the short term, it is also creating a potential value opportunity. The strategy is to exercise patience, allowing the sell-off to exhaust itself near the key technical and psychological supports at $205-$200, where the risk-reward profile becomes increasingly favorable for a strategic long-term entry.
Oracle Corporation (
ORCL) has experienced a significant bearish catalyst following its earnings report on Tuesday, September 9th, leading to a pronounced breakdown of its previous technical structure. The violation of a key Bull Flag pattern has invalidated the prior consolidation's bullish implications and suggests a new near-term downtrend is now in force. In this context, our strategy shifts to identifying strategic support levels for potential capital allocation once the selling pressure subsides. Key Fibonacci retracement levels at $205.61 and $167.52 provide initial targets, while the major psychological support at $200.00 presents a high-conviction buying zone where long-term value and technical support are expected to converge.Detailed Technical Breakdown:
1. The Catalytic Event and Pattern Breakdown:
The bearish gap down and subsequent sell-off post-earnings on September 9th represent a fundamental shift in market sentiment. This event acted as the decisive catalyst that shattered the technical picture.
Bull Flag Failure: The pattern that was previously interpreted as a Bull Flag—a typically bullish continuation signal—has now been conclusively broken to the downside. Instead of pausing before a move higher, the pattern has failed, indicating that the underlying supply (sellers) has overwhelmed demand (buyers). This breakdown signals that the path of least resistance has shifted downward, and the pattern's prior support level has now become a new resistance zone.
2. Revised Support Framework and Downside Targets:
Given the newly established downtrend, we utilize Fibonacci retracement levels of the stock's major prior upward swing to identify logical areas where the decline may find footing and buyer interest may return.
Initial Support (Shallow Retracement): 61.8% Fibonacci Level at $205.61
This level, known as the "Golden Ratio," is a deep but common retracement zone in a strong stock. A hold here would suggest that the long-term uptrend remains structurally sound despite the recent earnings-driven setback. However, given the magnitude of the breakdown, a mere bounce at this level may be temporary.
Secondary Support (Deep Retracement): 78.6% Fibonacci Level at $167.52
A retracement to this depth would indicate a more severe correction is underway, potentially shaking out weaker hands. While this suggests greater near-term weakness, it also represents a more significant "washout" level that could create a powerful long-term base and a higher-risk, higher-reward entry point.
3. The High-Conviction Value Zone: The $200.00 Psychological Support
Beyond the Fibonacci calculations, the $200.00 threshold stands as a critical major support. This round number carries immense psychological weight and often serves as a magnet for price action and a focal point for institutional buyers. The convergence of this major psychological level with the deep 61.8% Fibonacci retracement in the $205-$200 range creates a high-probability zone for a substantial buyer response.
Strategic Outlook & Scenario Planning:
Bearish Scenario (Immediate): The near-term momentum is bearish. Rallies are likely to be sold into, with the broken Bull Flag pattern (now resistance) capping any upward movements. The initial downside target is the $205.61 support zone.
Accumulation Scenario (Strategic): Our primary interest lies in the $205-$200 support band. A stabilization and reversal from this area, particularly on bullish volume patterns, would signal that the corrective phase may be complete and offer a compelling opportunity to establish or add to a position. A further decline toward the $167.52 level would represent a steeper de-valuation but would require a reassessment of the fundamental thesis.
In conclusion, while the breakdown is unequivocally bearish in the short term, it is also creating a potential value opportunity. The strategy is to exercise patience, allowing the sell-off to exhaust itself near the key technical and psychological supports at $205-$200, where the risk-reward profile becomes increasingly favorable for a strategic long-term entry.

Aviso legal
As informações e publicações não se destinam a ser, e não constituem, conselhos ou recomendações financeiras, de investimento, comerciais ou de outro tipo fornecidos ou endossados pela TradingView. Leia mais nos Termos de Uso.
Aviso legal
As informações e publicações não se destinam a ser, e não constituem, conselhos ou recomendações financeiras, de investimento, comerciais ou de outro tipo fornecidos ou endossados pela TradingView. Leia mais nos Termos de Uso.