
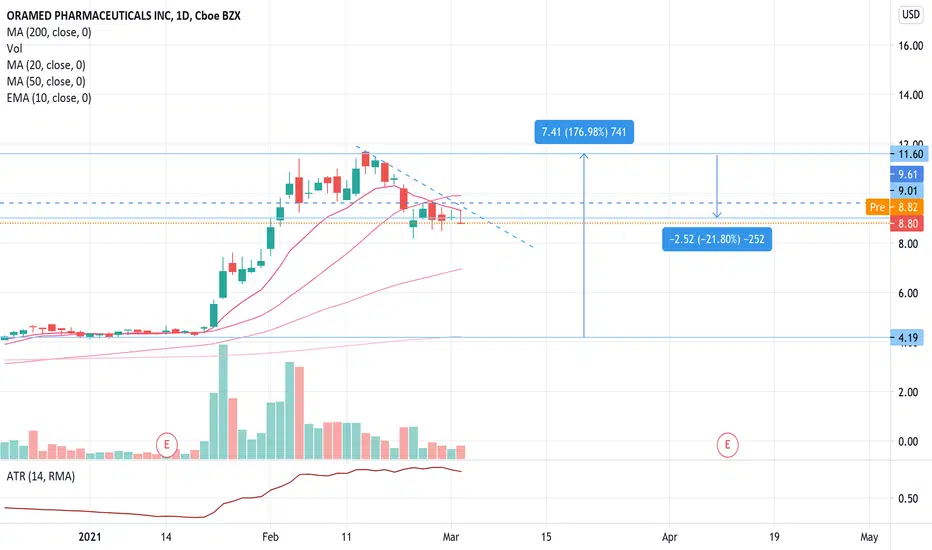
High tight flag chart pattern forms when a stock rises over 90% (preferably 100%) or more in two months, then consolidates sideways for 15-25 days with a decline of no more than 25%. When there's a breakout of the sideways 'flag' on high volume , the powerful uptrend often resumes.
The entry point is either as the stock breaks the high of the flag or breaks a downtrend line - but only ever on higher than average volume.
Looking for an entry if it breaks back above the moving average lines on higher than average volume. ATR and volume declining recently is a good sign.
The entry point is either as the stock breaks the high of the flag or breaks a downtrend line - but only ever on higher than average volume.
Looking for an entry if it breaks back above the moving average lines on higher than average volume. ATR and volume declining recently is a good sign.

Aviso legal
As informações e publicações não se destinam a ser, e não constituem, conselhos ou recomendações financeiras, de investimento, comerciais ou de outro tipo fornecidos ou endossados pela TradingView. Leia mais nos Termos de Uso.
Aviso legal
As informações e publicações não se destinam a ser, e não constituem, conselhos ou recomendações financeiras, de investimento, comerciais ou de outro tipo fornecidos ou endossados pela TradingView. Leia mais nos Termos de Uso.