Palantir ( PLTR): Testing Major Support Floor – High-Probability Mean Reversion vs. Breakdown Matrix
### 💻 Palantir Technologies (PLTR) Daily Technical Framework (Ref: PLTR_2026-06-15_08-57-30.png)
We are tracking a pivotal market structure inflection point on Palantir Technologies (PLTR - NASDAQ) as price action descends directly into a major multi-month institutional support floor.
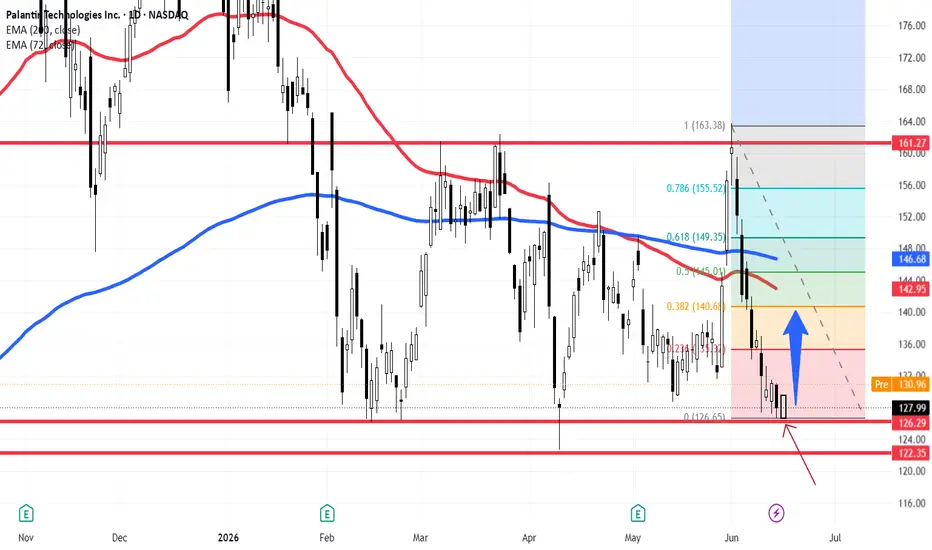
The current daily session is trading down **-2.36% at 127.99**, aggressively testing the solid red horizontal baseline at **126.29**, which precisely aligns with our local **0 Fibonacci retracement layer at 126.65**.
As we approach this key technical junction, we have structured two highly defined execution playbooks based on systematic price confirmation:
---
### 📈 Playbook A: Structural Mean-Reversion (The Higher Probability Vector)
* **The Trigger:** We are closely monitoring the daily candle close. If buyers defend this floor, printing a strong bullish rejection candlestick signature prior to any breakdown, a tactical long setup is triggered.
* **The Technical Target Zone:** The resulting upward squeeze (indicated by the solid blue vector) targets a highly confluent dynamic magnet zone between **$142.00 and $146.00**.
* **Confluence Metrics:** This premium target area is bound by the **0.5 Fibonacci level (145.01)**, the descending **72-period EMA (red line at 142.95)**, and the long-term institutional baseline—the **200-period EMA (blue line at 146.68)**.
### 📉 Playbook B: Sustained Support Breakdown (The Continuation Short)
* **The Trigger:** If selling pressure forces a clean, decisive daily breakdown below the **126.29** horizontal floor over the coming sessions, the local bullish thesis is entirely invalidated.
* **The Execution Protocol:** To prevent chasing late distribution liquidity, we will remain patient. We will wait for a structural pullback back up to the broken baseline—confirming the old support has officially flipped into overhead supply resistance—before executing a short entry.
* **The Target:** A verified rejection on the retest opens the path down toward the next historical demand layer at the horizontal line of **122.35**.
### Tactical Summary:
While a breakdown is entirely possible, the current momentum profile and structural location suggest that an overextended mean-reversion pop back toward the EMA cluster represents the path of least resistance. We will let the daily print finalize today to validate our initial trigger.
---
📊 **ChartPro Data** | By Rogerio Zaglia
*Systematic Equity Research, Market Geometry & Quantitative Risk Management.*
⚠️ **Disclaimer:** For educational and informational purposes only. This technical analysis represents a personal trading framework and does not constitute financial or investment advice.
PLTR): Testing Major Support Floor – High-Probability Mean Reversion vs. Breakdown Matrix### 💻 Palantir Technologies (
PLTR) Daily Technical Framework (Ref: PLTR_2026-06-15_08-57-30.png)We are tracking a pivotal market structure inflection point on Palantir Technologies (
PLTR - NASDAQ) as price action descends directly into a major multi-month institutional support floor. The current daily session is trading down **-2.36% at 127.99**, aggressively testing the solid red horizontal baseline at **126.29**, which precisely aligns with our local **0 Fibonacci retracement layer at 126.65**.
As we approach this key technical junction, we have structured two highly defined execution playbooks based on systematic price confirmation:
---
### 📈 Playbook A: Structural Mean-Reversion (The Higher Probability Vector)
* **The Trigger:** We are closely monitoring the daily candle close. If buyers defend this floor, printing a strong bullish rejection candlestick signature prior to any breakdown, a tactical long setup is triggered.
* **The Technical Target Zone:** The resulting upward squeeze (indicated by the solid blue vector) targets a highly confluent dynamic magnet zone between **$142.00 and $146.00**.
* **Confluence Metrics:** This premium target area is bound by the **0.5 Fibonacci level (145.01)**, the descending **72-period EMA (red line at 142.95)**, and the long-term institutional baseline—the **200-period EMA (blue line at 146.68)**.
### 📉 Playbook B: Sustained Support Breakdown (The Continuation Short)
* **The Trigger:** If selling pressure forces a clean, decisive daily breakdown below the **126.29** horizontal floor over the coming sessions, the local bullish thesis is entirely invalidated.
* **The Execution Protocol:** To prevent chasing late distribution liquidity, we will remain patient. We will wait for a structural pullback back up to the broken baseline—confirming the old support has officially flipped into overhead supply resistance—before executing a short entry.
* **The Target:** A verified rejection on the retest opens the path down toward the next historical demand layer at the horizontal line of **122.35**.
### Tactical Summary:
While a breakdown is entirely possible, the current momentum profile and structural location suggest that an overextended mean-reversion pop back toward the EMA cluster represents the path of least resistance. We will let the daily print finalize today to validate our initial trigger.
---
📊 **ChartPro Data** | By Rogerio Zaglia
*Systematic Equity Research, Market Geometry & Quantitative Risk Management.*
⚠️ **Disclaimer:** For educational and informational purposes only. This technical analysis represents a personal trading framework and does not constitute financial or investment advice.

Aviso legal
As informações e publicações não se destinam a ser, e não constituem, conselhos ou recomendações financeiras, de investimento, comerciais ou de outro tipo fornecidos ou endossados pela TradingView. Leia mais nos Termos de Uso.
Aviso legal
As informações e publicações não se destinam a ser, e não constituem, conselhos ou recomendações financeiras, de investimento, comerciais ou de outro tipo fornecidos ou endossados pela TradingView. Leia mais nos Termos de Uso.