
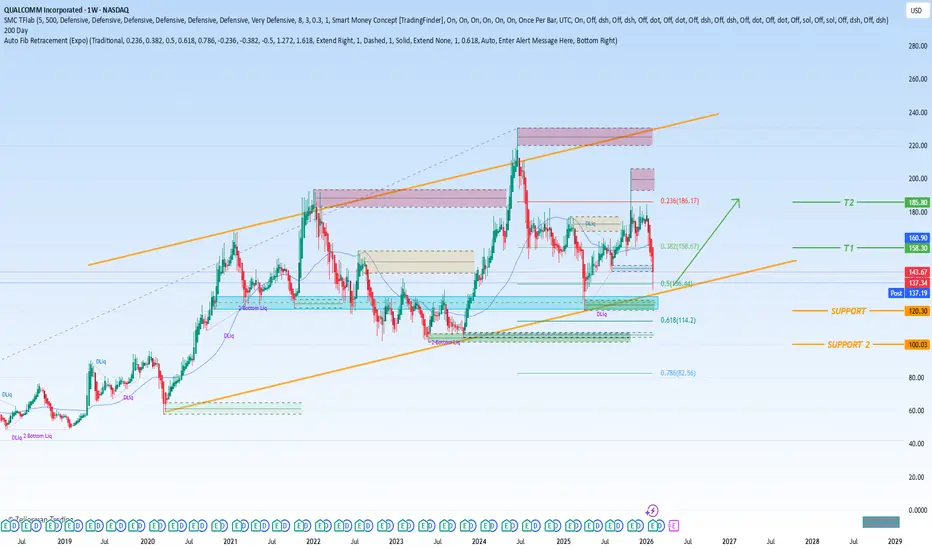
Qualcomm Inc. (NASDAQ: QCOM), a titan within the global semiconductor industry, recently presented a classic case of a solid earnings report overshadowed by cautious forward guidance, triggering a sharp reassessment by investors and sophisticated options traders. The company’s fiscal first-quarter results were fundamentally robust on a historical basis, with earnings per share of $3.50 and revenue of $12.25 billion surpassing consensus estimates of $3.15 and $12.22 billion, respectively, and marking year-over-year growth. However, the subsequent market reaction was decisively negative, driven by management’s underwhelming guidance for the current quarter, which fell short of Wall Street’s expectations.
This guidance revision was largely attributed to mounting competitive pressures, particularly within the critical handset market, where Chinese original equipment manufacturers (OEMs) have been scaling back their forecasts. This dynamic forced Qualcomm to temper its near-term outlook, casting a shadow over its otherwise strong performance and sending QCOM stock down approximately 19% year-to-date. In response to this heightened uncertainty and clear downside risk, the "smart money" in the options market has pivoted decisively toward defensive positioning, a move that has created a unique landscape for potential bullish speculation.
The Options Market Signal: Prioritizing Downside Protection
The sentiment shift is most clearly visible in the volatility skew for QCOM options. For the March 20 expiration, the curvature of this skew shows elevated implied volatility (IV) on both ends of the strike price spectrum, with put option IV significantly outpacing call option IV. This pattern indicates that institutional and sophisticated traders are primarily focused on acquiring insurance against further downside volatility. This hedging activity often manifests through strategic positions like deep in-the-money (ITM) puts, which mechanically gain value as the stock falls. While this defensive posture is a rational response to the stock's recent trajectory, a notable secondary effect has been the relative cheapening of bullish call options. For investors with a constructive long-term view, this environment presents a potential opportunity to express a bullish stance at a discounted premium.
Quantifying the Expected Range: The Black-Scholes Framework
To translate this market sentiment into a tangible trading range, we can employ the Black-Scholes options pricing model. For the March 20 expiration, the model’s derived expected move suggests QCOM stock could trade within a range of approximately $127.55 to $149.63. This symmetrical band, representing one standard deviation from the current spot price, implies that in roughly 68% of probable outcomes over the next 42 days, the stock will fluctuate within this 7.96% high-low spread. While instructive, this first-order analysis provides a broad search area. Given the stock's recent pattern of decline—printing only four up weeks out of the last ten—a more nuanced, context-aware model is required to refine probability estimates.
Applying the Markov Property and Bayesian Inference for Context
To move beyond the generalized Black-Scholes output, we can apply the Markov property, which posits that the future state of a system depends solely on its present state. In trading terms, forward probabilities should be assessed within the context of recent price action, not in isolation. By analyzing QCOM’s recent discretized price sequence (a 4-6-D pattern of down weeks), we can model likely future drift patterns more accurately. This Bayesian-inspired methodology of pattern recognition, while not philosophically infallible, offers a superior probabilistic framework in an uncertain environment.
Based on this contextual, quantitative analysis, the probable trading range for QCOM over the next ten weeks is refined to between $132 and $158, with probability density likely peaking near $140. The analysis further suggests that density may remain relatively elevated up to the $150 level before a significant drop-off. This creates a scenario where a targeted, defined-risk bullish strategy becomes mathematically compelling.
A Structured Trade: The 145/150 Bull Call Spread
Given this probabilistic setup, a structured options trade such as a 145/150 bull call spread expiring March 20 offers a favorable risk-reward profile. This vertical spread involves buying a call at the $145 strike and selling a call at the $150 strike. The wager requires QCOM to rise through the $150 strike at expiration—an ambitious but contextually reasonable target within the refined expected range. The trade’s maximum payout approaches 229%, with a breakeven point at $146.52. This structure benefits from the currently depressed price of call options and aligns with the quantitative inference that the stock has a credible path toward the $150 region before facing substantial resistance.
Technical Levels and Strategic Framework
For investors and traders managing positions, key technical levels provide essential guideposts for risk and reward:
Critical Support Zones:
Primary Support: $120 – A breach below this level would signal a breakdown of the current consolidation and potentially invalidate the near-term bullish technical thesis, likely triggering another wave of defensive hedging.
Major Long-Term Support: $100 – This represents a foundational support zone from prior cycles. A decline to this area would indicate a deep bearish repricing but could also present a strategic, long-term accumulation point for value-oriented investors.
Fibonacci Retracement Take-Profit Targets (from a prior significant high):
Initial Recovery Target: $158.67 – Corresponding to the 0.382 Fibonacci retracement level. A move to this zone would represent a strong technical recovery and validate a reversal of the recent downtrend.
Extended Bullish Target: $186.17 – Aligning with the 0.618 Fibonacci level. Achieving this target would signify a full recovery of the prior downtrend and signal a resumption of the primary long-term bullish momentum.
Conclusion: A High-Conviction, Quantitatively-Informed Opportunity
In summary, Qualcomm stands at a crossroads. Near-term competitive headwinds have justifiably prompted caution and defensive positioning in the market. However, this very sentiment has created a scenario where bullish expressions are priced at a relative discount. By combining observable options market skew with quantitative modeling via Markov-influenced and Bayesian-inspired analysis, a coherent picture emerges: the stock has a statistically credible path toward recovery into the $150 range over the coming weeks. For disciplined traders, the 145/150 bull call spread offers a leveraged, defined-risk vehicle to capitalize on this probabilistic outcome. Investors should monitor the identified support levels closely, as holds above $120 would be crucial for maintaining the constructive technical and quantitative thesis, while a break below could necessitate a fundamental reassessment of the competitive landscape and its impact on Qualcomm's medium-term prospects.

Aviso legal
As informações e publicações não se destinam a ser, e não constituem, conselhos ou recomendações financeiras, de investimento, comerciais ou de outro tipo fornecidos ou endossados pela TradingView. Leia mais nos Termos de Uso.
Aviso legal
As informações e publicações não se destinam a ser, e não constituem, conselhos ou recomendações financeiras, de investimento, comerciais ou de outro tipo fornecidos ou endossados pela TradingView. Leia mais nos Termos de Uso.