
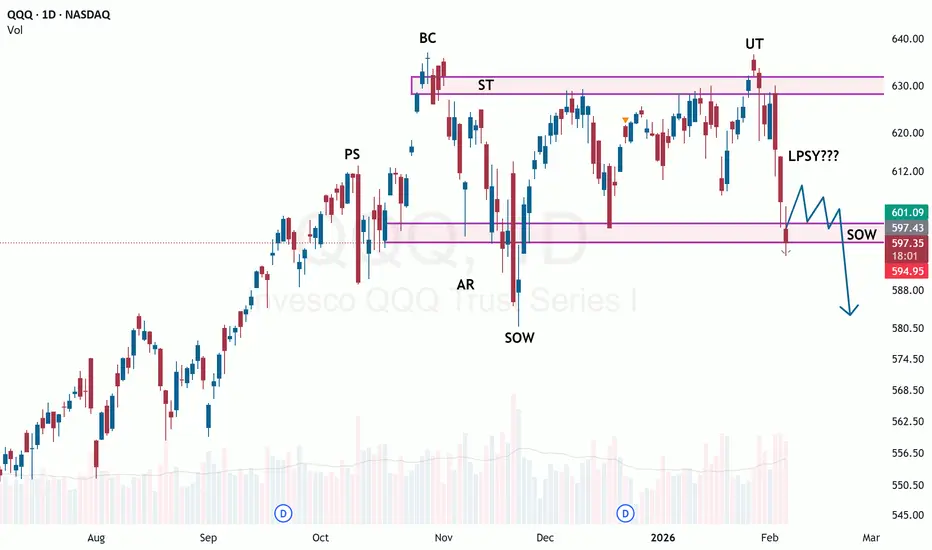
I believe I have identified another Wyckoff distribution pattern on QQQ. In early October, we saw the first signs of selling. We got a selling climax at the start of November. We have consolidated within this range over the past 3 months, testing the channel's highs and lows. It is not a perfect Wyckoff schematic, but the volume has certainly supported a move lower especially as of late.
For confirmation, I would like to see this current support level hold one more time. If it does, it would be the buyer's last gasp before taking out the low like a crashing elevator. I am effectively looking for some form of bear flag, descending triangle, or rising wedge pattern.
I will consider this trade invalidated if we begin to see strong closings above the midline of the channel. At that point, I may need to reassess the quality of the pattern or confirm that the pattern has failed.
The target to the downside would first be the 200 MA, which currently rests at 577. Below there is 560. I am still a bit fuzzy on the calculations of Wyckoff, but the point-and-figure chart suggests the final target should be about 520. I feel we would need a strong catalyst to reach those levels, but anything is possible these days.
For confirmation, I would like to see this current support level hold one more time. If it does, it would be the buyer's last gasp before taking out the low like a crashing elevator. I am effectively looking for some form of bear flag, descending triangle, or rising wedge pattern.
I will consider this trade invalidated if we begin to see strong closings above the midline of the channel. At that point, I may need to reassess the quality of the pattern or confirm that the pattern has failed.
The target to the downside would first be the 200 MA, which currently rests at 577. Below there is 560. I am still a bit fuzzy on the calculations of Wyckoff, but the point-and-figure chart suggests the final target should be about 520. I feel we would need a strong catalyst to reach those levels, but anything is possible these days.
Trade ativo
We've retested the midline of the channel but we are not in the clear yet. Even with todays short term selling, we still need to see a strong close below the channel. Otherwise, this selling we are seeing currently is just fluff. In other words, we should be worried above 617 and short biased below 595.Nota
Looks like the Qs have already started unwinding. Ive got my eyes on 540 as an eventual target. Wouldnt be mad at profit taking here.
Aviso legal
As informações e publicações não se destinam a ser, e não constituem, conselhos ou recomendações financeiras, de investimento, comerciais ou de outro tipo fornecidos ou endossados pela TradingView. Leia mais nos Termos de Uso.
Aviso legal
As informações e publicações não se destinam a ser, e não constituem, conselhos ou recomendações financeiras, de investimento, comerciais ou de outro tipo fornecidos ou endossados pela TradingView. Leia mais nos Termos de Uso.