
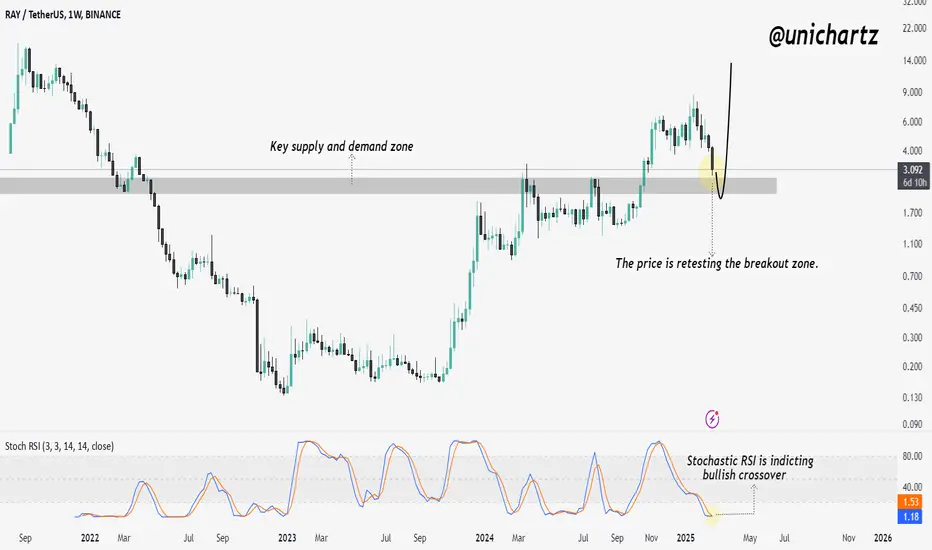
RRAY/USDT chart shows a key retest of the breakout zone, which previously acted as resistance and is now a crucial support level. A successful bounce could confirm bullish continuation, while a breakdown may lead to further downside.
Additionally, the Stochastic RSI is signaling a bullish crossover at oversold levels, indicating potential upward momentum. If buyers hold this zone, RAY could see a strong rally.
DYOR, NFA
Additionally, the Stochastic RSI is signaling a bullish crossover at oversold levels, indicating potential upward momentum. If buyers hold this zone, RAY could see a strong rally.
DYOR, NFA

Daily Free Signals :bit.ly/UnichartzAlpha
Register on Bitunix and trade with me: 👇
bitunix.com/register?vipCode=coEA
Register on Bitunix and trade with me: 👇
bitunix.com/register?vipCode=coEA
Aviso legal
As informações e publicações não se destinam a ser, e não constituem, conselhos ou recomendações financeiras, de investimento, comerciais ou de outro tipo fornecidos ou endossados pela TradingView. Leia mais nos Termos de Uso.
Daily Free Signals :bit.ly/UnichartzAlpha
Register on Bitunix and trade with me: 👇
bitunix.com/register?vipCode=coEA
Register on Bitunix and trade with me: 👇
bitunix.com/register?vipCode=coEA
Aviso legal
As informações e publicações não se destinam a ser, e não constituem, conselhos ou recomendações financeiras, de investimento, comerciais ou de outro tipo fornecidos ou endossados pela TradingView. Leia mais nos Termos de Uso.