
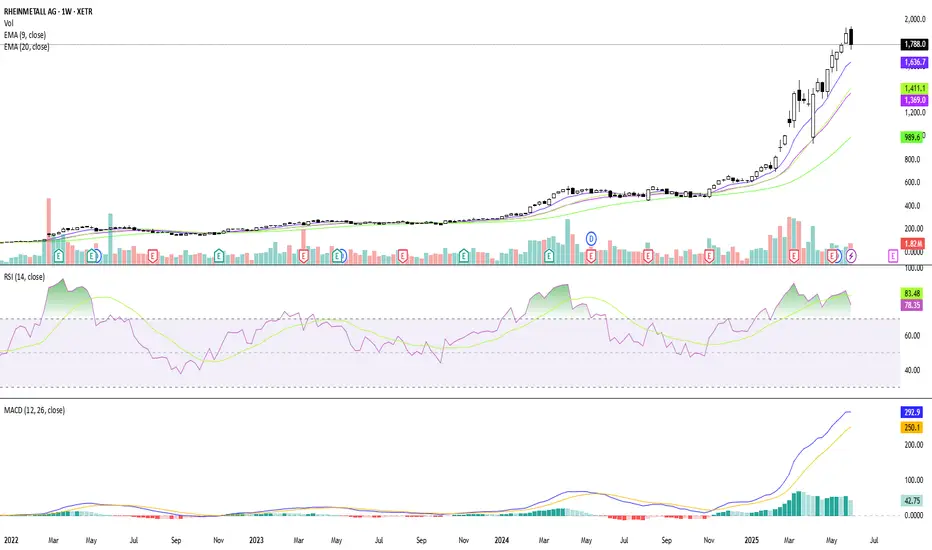
This chart is part of my active trading analysis on Rheinmetall (RHM.DE), focusing on both intraday movements and short-term trends (2–5 days).
Included Indicators:
EMA (9, 20, 50) – to assess momentum and dynamic support/resistance
RSI (14) – for overbought/oversold levels
MACD – to detect potential trend reversals
Volume – for confirmation of breakouts or fading moves
Included Indicators:
EMA (9, 20, 50) – to assess momentum and dynamic support/resistance
RSI (14) – for overbought/oversold levels
MACD – to detect potential trend reversals
Volume – for confirmation of breakouts or fading moves

Aviso legal
As informações e publicações não se destinam a ser, e não constituem, conselhos ou recomendações financeiras, de investimento, comerciais ou de outro tipo fornecidos ou endossados pela TradingView. Leia mais nos Termos de Uso.
Aviso legal
As informações e publicações não se destinam a ser, e não constituem, conselhos ou recomendações financeiras, de investimento, comerciais ou de outro tipo fornecidos ou endossados pela TradingView. Leia mais nos Termos de Uso.