
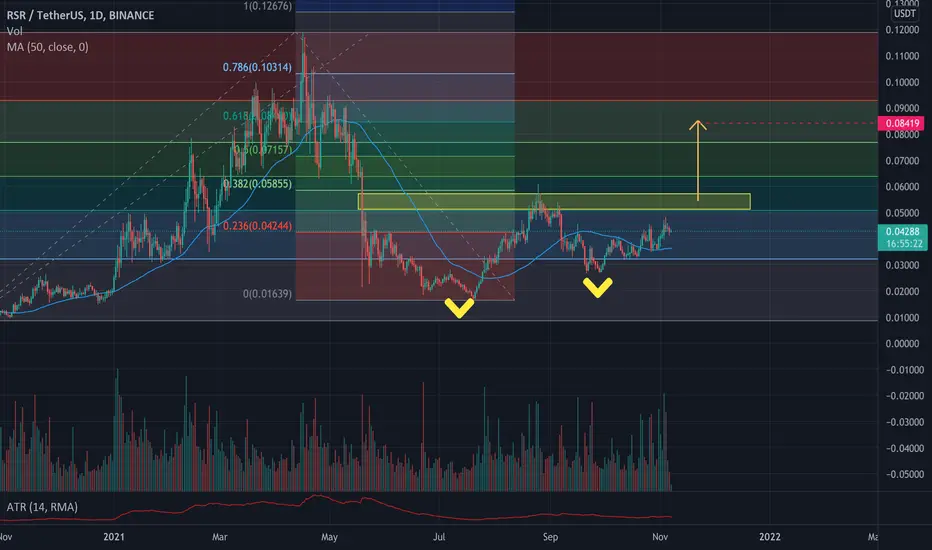
Based on my TA, RSR is currently forming a double bottom on the weekly chart and on the daily chart it is trading above the 50MA which is a good indication. However, there is a strong resistance at the yellow triangle ($0.05-$0.058)
I would go long if it broke this level and close 2 daily candles above the yellow triangle.
SL: $0.048
TP1:$0.065
TP2:$0.073
TP3: $0.084
I would go long if it broke this level and close 2 daily candles above the yellow triangle.
SL: $0.048
TP1:$0.065
TP2:$0.073
TP3: $0.084

Aviso legal
As informações e publicações não se destinam a ser, e não constituem, conselhos ou recomendações financeiras, de investimento, comerciais ou de outro tipo fornecidos ou endossados pela TradingView. Leia mais nos Termos de Uso.
Aviso legal
As informações e publicações não se destinam a ser, e não constituem, conselhos ou recomendações financeiras, de investimento, comerciais ou de outro tipo fornecidos ou endossados pela TradingView. Leia mais nos Termos de Uso.