
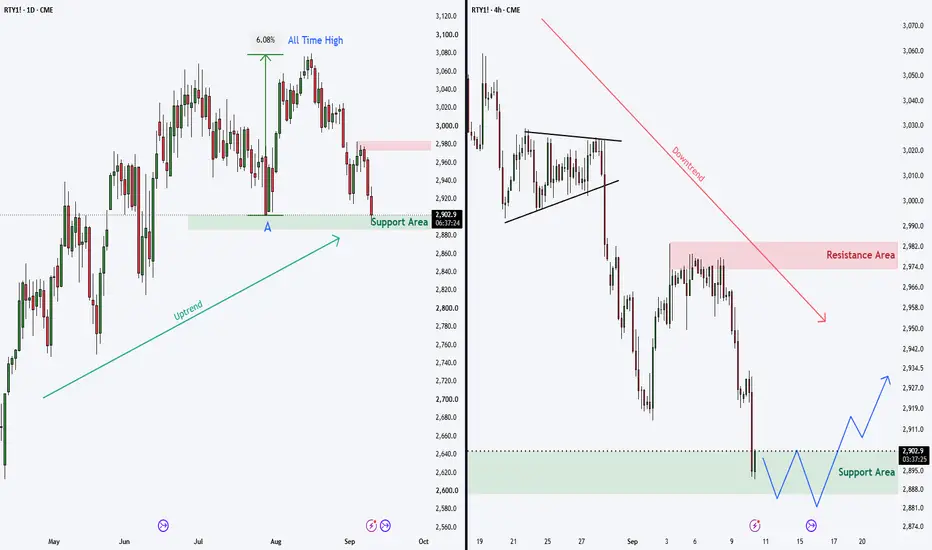
RTY1! Multiple Timeframe Analysis:
On the Daily chart (LEFT), we can see that this price zone (A) previously acted as support and led to a strong +6% move to a new all-time high. The Daily chart is still in an uptrend.
However, the 4H chart (RIGHT) is trending steadily lower, and at the moment there is no clear sign that the downtrend is coming to an end.
Since the Daily trend (LEFT) remains intact, we could potentially see a bullish reversal if a double bottom, a breakdown failure, or a strong bullish candle forms on the 4H chart (RIGHT). Such a setup could lead to an upward move toward the $2,980 resistance area, or potentially even higher.

Aviso legal
As informações e publicações não se destinam a ser, e não constituem, conselhos ou recomendações financeiras, de investimento, comerciais ou de outro tipo fornecidos ou endossados pela TradingView. Leia mais nos Termos de Uso.
Aviso legal
As informações e publicações não se destinam a ser, e não constituem, conselhos ou recomendações financeiras, de investimento, comerciais ou de outro tipo fornecidos ou endossados pela TradingView. Leia mais nos Termos de Uso.