
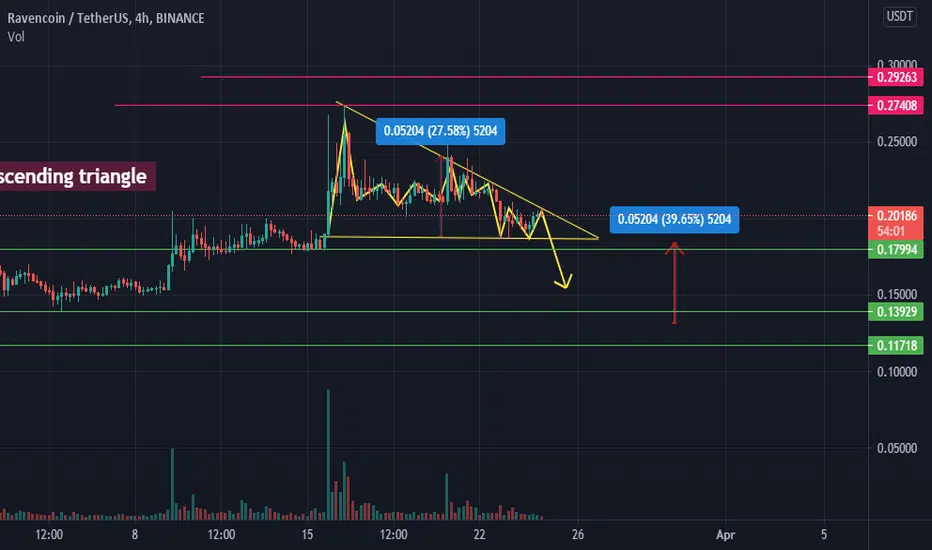
We can see a descending triangle on 4 hour chart of RVN/USDT (Binance).
DESCENDING TRIANGLE has bearish reversal interpretation.
If it breaks it support line it will breakdown to the marked point.
Red lines represents major resistances while green are showing major supports.
We can clearly see 2 valid taps on resistance line and support line inside the formed triangle.
Dial indicator showing ( Bought indicator ) means that the current volume is at sell signal.
DESCENDING TRIANGLE has bearish reversal interpretation.
If it breaks it support line it will breakdown to the marked point.
Red lines represents major resistances while green are showing major supports.
We can clearly see 2 valid taps on resistance line and support line inside the formed triangle.
Dial indicator showing ( Bought indicator ) means that the current volume is at sell signal.

Aviso legal
As informações e publicações não se destinam a ser, e não constituem, conselhos ou recomendações financeiras, de investimento, comerciais ou de outro tipo fornecidos ou endossados pela TradingView. Leia mais nos Termos de Uso.
Aviso legal
As informações e publicações não se destinam a ser, e não constituem, conselhos ou recomendações financeiras, de investimento, comerciais ou de outro tipo fornecidos ou endossados pela TradingView. Leia mais nos Termos de Uso.