
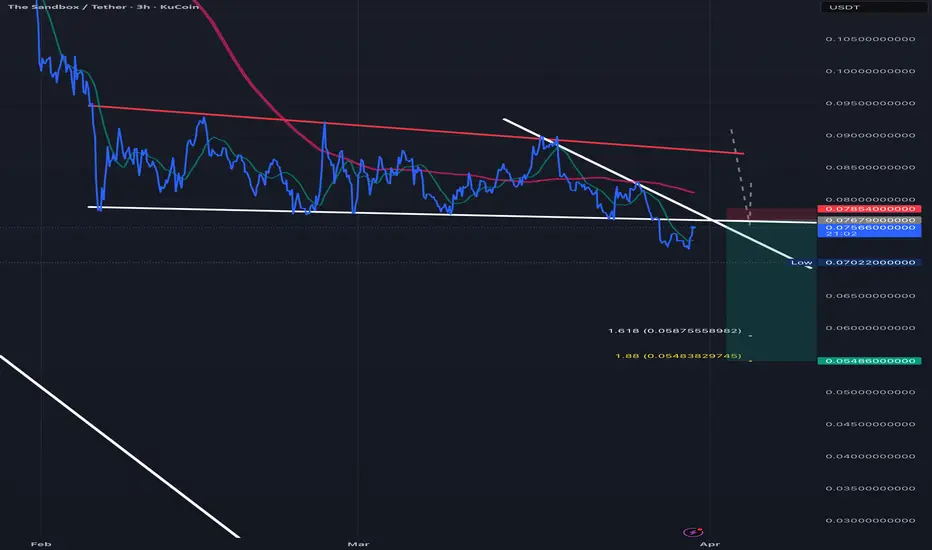
1. The Setup: "The Squeeze"
Imagine the price is bouncing between a **slanted ceiling** (the red line) and a **flat floor** (the white line).
* The ceiling is pushing the price down lower and lower.
* The floor is holding it up.
* Eventually, the space runs out, and the price has to "burst" through one of them.
### 2. The Move: "The Breakdown"
In your chart, the price just **fell through the floor**. This is the signal to sell (or "Short").
* Once a floor breaks, it usually becomes the new ceiling.
* The fact that the price is staying below that white line suggests the "break" is real.
### 3. The Plan (Your Strategy)
You are essentially betting that since the floor broke, the price will gravity-drop to the next level.
* **Entry:** You enter right after the floor breaks ($0.0755).
* **Stop Loss (The Emergency Brake):** You set a limit at **$0.0785**. If the price jumps back *above* the floor, the trade is "broken," and you get out to protect your money.
* **Take Profit (The Goal):** You are aiming for **$0.0548**. This is based on the height of the triangle—basically, the "energy" the move had before it broke.
### 4. Summary
* **Pattern:** Descending Triangle (Bearish).
* **Signal:** Candle closing below the white support line.
* **Goal:** Catch the drop to the Fibonacci targets

Aviso legal
As informações e publicações não se destinam a ser, e não constituem, conselhos ou recomendações financeiras, de investimento, comerciais ou de outro tipo fornecidos ou endossados pela TradingView. Leia mais nos Termos de Uso.
Aviso legal
As informações e publicações não se destinam a ser, e não constituem, conselhos ou recomendações financeiras, de investimento, comerciais ou de outro tipo fornecidos ou endossados pela TradingView. Leia mais nos Termos de Uso.