
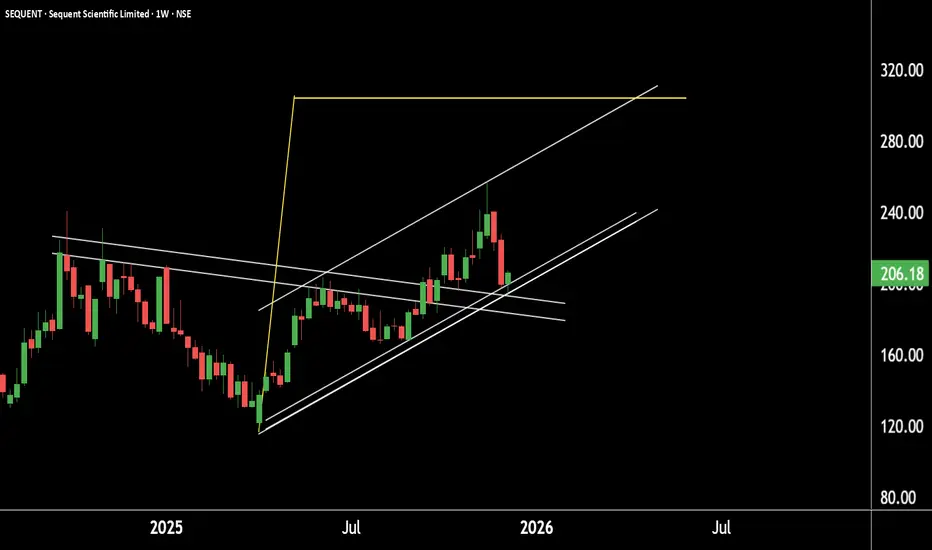
This is the weekly timeframe chart of Sequent Scientific.
The stock is currently trading near the key support zone of 180–190 and is moving within a well-defined structure.
If this support zone holds, we may see a potential upside move towards the 280 and 300 levels.
Thank you.
The stock is currently trading near the key support zone of 180–190 and is moving within a well-defined structure.
If this support zone holds, we may see a potential upside move towards the 280 and 300 levels.
Thank you.

@RahulSarawagi
Connect us at optionlab.co.in/
Connect us at optionlab.co.in/
Aviso legal
As informações e publicações não se destinam a ser, e não constituem, conselhos ou recomendações financeiras, de investimento, comerciais ou de outro tipo fornecidos ou endossados pela TradingView. Leia mais nos Termos de Uso.
@RahulSarawagi
Connect us at optionlab.co.in/
Connect us at optionlab.co.in/
Aviso legal
As informações e publicações não se destinam a ser, e não constituem, conselhos ou recomendações financeiras, de investimento, comerciais ou de outro tipo fornecidos ou endossados pela TradingView. Leia mais nos Termos de Uso.