
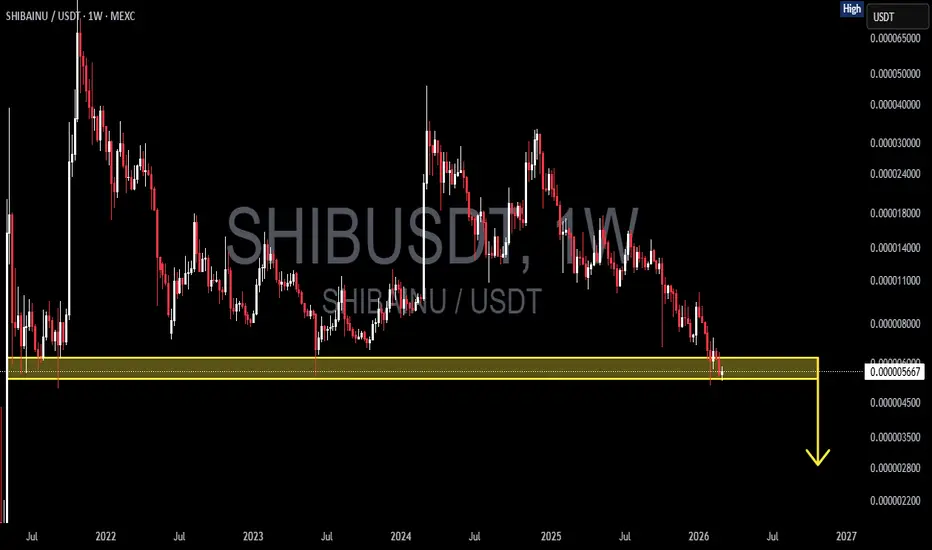
On the 1W timeframe, SHIBUSDT remains in a long-term downtrend since the 2021 peak. The structure clearly shows a consistent pattern of lower highs and lower lows.
Price has now declined and is testing a major historical demand/support zone at 0.00000626 – 0.00000535 (yellow block). This area previously acted as a strong reaction point during earlier market cycles.
The current structure shows increasing selling pressure, weakening the support level.
---
Pattern Formation
1. Lower High – Lower Low Structure (Bearish Market Structure)
Since 2022, price has failed to create a higher high.
Every rebound has been rejected at a lower resistance level.
This confirms long-term seller dominance.
2. Descending Structure Toward Major Support
Price continues to grind downward with gradual distribution into a key support zone.
3. Potential Base Breakdown
The 0.00000626 – 0.00000535 zone represents the last major base before a potential liquidity vacuum below. If this base fails, the downside move could accelerate significantly.
---
Key Levels
Main Support:
0.00000626 – 0.00000535 (current critical zone)
Next Support (if breakdown occurs):
0.00000350 – 0.00000280 (next historical low area)
Nearest Resistance:
0.00000800
0.00001100
0.00001400 (previous breakdown structure)
---
Bullish Scenario
The bullish scenario becomes valid if:
1. Price successfully holds above 0.00000535.
2. A strong weekly close occurs above 0.00000626.
3. Increased volume appears with a strong lower wick rejection.
Potential upside targets:
0.00000800
0.00001100
0.00001400
If a strong reclaim happens, this could mark the beginning of a long-term accumulation phase before a new cycle expansion.
However, as long as the lower high structure remains intact, any rally should be considered a relief rally.
---
Bearish Scenario
The bearish scenario is activated if:
1. A weekly close occurs below 0.00000535.
2. Breakdown is supported by high volume.
3. A failed retest confirms support turning into resistance.
Downside targets:
0.00000350
0.00000280 (area indicated by the arrow on the chart)
If this support breaks, SHIB could enter an extended distribution phase and potentially print new cycle lows.
---
Conclusion
SHIB is currently at a major decision point.
The 0.00000626 – 0.00000535 zone represents a critical market level:
Holding → potential strong rebound.
Breakdown → potential aggressive continuation toward 0.00000350 – 0.00000280.
From a macro structure perspective, the market remains bearish until proven otherwise. Weekly close confirmation is the key factor to watch.
Trading inside this zone without confirmation carries elevated risk, as it represents a major market decision area.
#SHIB #SHIBUSDT #CryptoAnalysis #TechnicalAnalysis #Altcoin #CryptoMarket #SupportResistance #Breakdown #ReversalZone #WeeklyChart
Price has now declined and is testing a major historical demand/support zone at 0.00000626 – 0.00000535 (yellow block). This area previously acted as a strong reaction point during earlier market cycles.
The current structure shows increasing selling pressure, weakening the support level.
---
Pattern Formation
1. Lower High – Lower Low Structure (Bearish Market Structure)
Since 2022, price has failed to create a higher high.
Every rebound has been rejected at a lower resistance level.
This confirms long-term seller dominance.
2. Descending Structure Toward Major Support
Price continues to grind downward with gradual distribution into a key support zone.
3. Potential Base Breakdown
The 0.00000626 – 0.00000535 zone represents the last major base before a potential liquidity vacuum below. If this base fails, the downside move could accelerate significantly.
---
Key Levels
Main Support:
0.00000626 – 0.00000535 (current critical zone)
Next Support (if breakdown occurs):
0.00000350 – 0.00000280 (next historical low area)
Nearest Resistance:
0.00000800
0.00001100
0.00001400 (previous breakdown structure)
---
Bullish Scenario
The bullish scenario becomes valid if:
1. Price successfully holds above 0.00000535.
2. A strong weekly close occurs above 0.00000626.
3. Increased volume appears with a strong lower wick rejection.
Potential upside targets:
0.00000800
0.00001100
0.00001400
If a strong reclaim happens, this could mark the beginning of a long-term accumulation phase before a new cycle expansion.
However, as long as the lower high structure remains intact, any rally should be considered a relief rally.
---
Bearish Scenario
The bearish scenario is activated if:
1. A weekly close occurs below 0.00000535.
2. Breakdown is supported by high volume.
3. A failed retest confirms support turning into resistance.
Downside targets:
0.00000350
0.00000280 (area indicated by the arrow on the chart)
If this support breaks, SHIB could enter an extended distribution phase and potentially print new cycle lows.
---
Conclusion
SHIB is currently at a major decision point.
The 0.00000626 – 0.00000535 zone represents a critical market level:
Holding → potential strong rebound.
Breakdown → potential aggressive continuation toward 0.00000350 – 0.00000280.
From a macro structure perspective, the market remains bearish until proven otherwise. Weekly close confirmation is the key factor to watch.
Trading inside this zone without confirmation carries elevated risk, as it represents a major market decision area.
#SHIB #SHIBUSDT #CryptoAnalysis #TechnicalAnalysis #Altcoin #CryptoMarket #SupportResistance #Breakdown #ReversalZone #WeeklyChart

✅ Get Free Signals! Join Our Telegram Channel Here: t.me/TheCryptoNuclear
✅ Twitter: twitter.com/crypto_nuclear
✅ Join Bybit : partner.bybit.com/b/nuclearvip
✅ Benefits : Lifetime Trading Fee Discount -50%
✅ Twitter: twitter.com/crypto_nuclear
✅ Join Bybit : partner.bybit.com/b/nuclearvip
✅ Benefits : Lifetime Trading Fee Discount -50%
Aviso legal
As informações e publicações não se destinam a ser, e não constituem, conselhos ou recomendações financeiras, de investimento, comerciais ou de outro tipo fornecidos ou endossados pela TradingView. Leia mais nos Termos de Uso.
✅ Get Free Signals! Join Our Telegram Channel Here: t.me/TheCryptoNuclear
✅ Twitter: twitter.com/crypto_nuclear
✅ Join Bybit : partner.bybit.com/b/nuclearvip
✅ Benefits : Lifetime Trading Fee Discount -50%
✅ Twitter: twitter.com/crypto_nuclear
✅ Join Bybit : partner.bybit.com/b/nuclearvip
✅ Benefits : Lifetime Trading Fee Discount -50%
Aviso legal
As informações e publicações não se destinam a ser, e não constituem, conselhos ou recomendações financeiras, de investimento, comerciais ou de outro tipo fornecidos ou endossados pela TradingView. Leia mais nos Termos de Uso.