
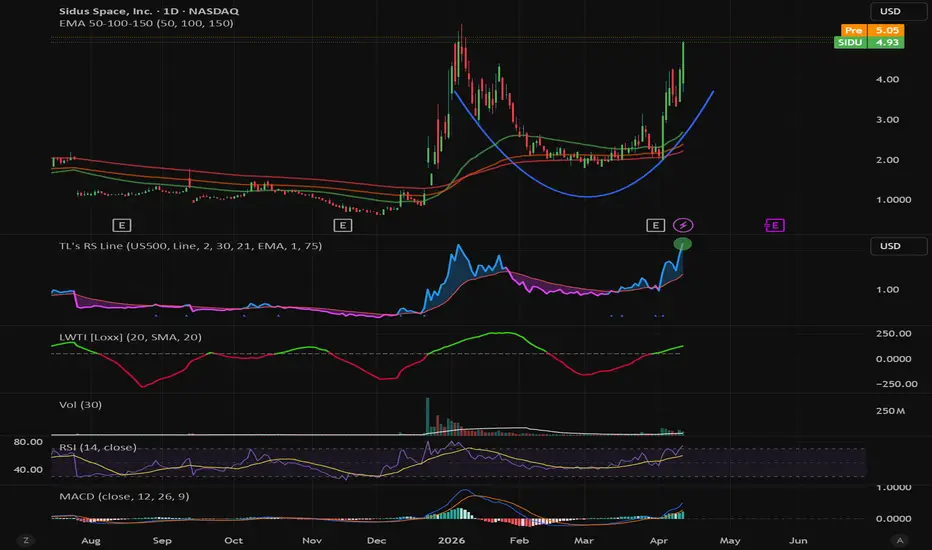
The recent price action in Sidus Space (SIDU) has printed one of the cleanest technical setups in the current Space sector market cycle. Over the past 3 months, from January 2026 through April 2026 - SIDU has meticulously carved out a classical Rounding Bottom (Cup) pattern, signaling a major trend reversal from accumulation to a parabolic breakout.
The Technical Blueprint: Precision in Motion
What makes this formation particularly remarkable is the role of the 150-day Exponential Moving Average (EMA 150). Throughout the first quarter of 2026, the EMA 150 acted as a visual guide for the "cup," tracing the price as it bottomed near $1.50 and steadily climbed back. This confirms that the long-term institutional bias has shifted from distribution to heavy accumulation.
The Breakout Catalyst
Yesterday, the pressure finally blew the lid off. SIDU surged +16% on a massive volume of 36 million shares -representing a 2.1x increase over its average daily volume. This wasn't just a price spike; it was a structural shift:.
Donchian Channel Breach: Price broke above the upper boundary of the 20-day Donchian Channel, marking a clear 20-day high and a volatility expansion to the upside.
Pre-Market Momentum: As of this morning, SIDU has already cleared the psychological $5.00 barrier, trading around $5.04 - $5.08.
Indicator Confirmation
Relative Strength (RS Line): SIDU is significantly outperforming S&P 500 proving it is a leader in the current market regime.
MACD & LWTI: The MACD histogram is expanding in the green, and the Larry Williams Trend Indicator (LWTI) has crossed comfortably above 50, confirming the bullish trend is now "in gear."
RSI Caution: The RSI currently sits at 74. While this confirms extreme strength, it also puts the stock in "Overbought" territory. Traders should anticipate a potential "throwback" or a brief consolidation before the next leg up.
Price Targets & Key Levels
Based on the depth of the cup formation, the technical measurements point to significant upside:
Immediate Support: $4.30 – $4.36 (The prior resistance-turned-support zone).
Secondary Support: $4.00.
Near-Term Target: $5.39.
Major Technical Target: $6.50 – $6.75 (Aligning with the cup's height projection and psychological resistance).
Bottom Line
SIDU has transitioned from a sleeper to a high-momentum leader. While the RSI suggests a short-term cooling-off period might occur, the volume-backed breakout of a 4-month base is a powerful signal. The plan: Watch for a successful retest of the $4.30 level or a consolidation above $5.00 as a base for the next rally toward $6.75.
Disclaimer: This analysis is for educational purposes only and does not constitute financial advice.
The Technical Blueprint: Precision in Motion
What makes this formation particularly remarkable is the role of the 150-day Exponential Moving Average (EMA 150). Throughout the first quarter of 2026, the EMA 150 acted as a visual guide for the "cup," tracing the price as it bottomed near $1.50 and steadily climbed back. This confirms that the long-term institutional bias has shifted from distribution to heavy accumulation.
The Breakout Catalyst
Yesterday, the pressure finally blew the lid off. SIDU surged +16% on a massive volume of 36 million shares -representing a 2.1x increase over its average daily volume. This wasn't just a price spike; it was a structural shift:.
Donchian Channel Breach: Price broke above the upper boundary of the 20-day Donchian Channel, marking a clear 20-day high and a volatility expansion to the upside.
Pre-Market Momentum: As of this morning, SIDU has already cleared the psychological $5.00 barrier, trading around $5.04 - $5.08.
Indicator Confirmation
Relative Strength (RS Line): SIDU is significantly outperforming S&P 500 proving it is a leader in the current market regime.
MACD & LWTI: The MACD histogram is expanding in the green, and the Larry Williams Trend Indicator (LWTI) has crossed comfortably above 50, confirming the bullish trend is now "in gear."
RSI Caution: The RSI currently sits at 74. While this confirms extreme strength, it also puts the stock in "Overbought" territory. Traders should anticipate a potential "throwback" or a brief consolidation before the next leg up.
Price Targets & Key Levels
Based on the depth of the cup formation, the technical measurements point to significant upside:
Immediate Support: $4.30 – $4.36 (The prior resistance-turned-support zone).
Secondary Support: $4.00.
Near-Term Target: $5.39.
Major Technical Target: $6.50 – $6.75 (Aligning with the cup's height projection and psychological resistance).
Bottom Line
SIDU has transitioned from a sleeper to a high-momentum leader. While the RSI suggests a short-term cooling-off period might occur, the volume-backed breakout of a 4-month base is a powerful signal. The plan: Watch for a successful retest of the $4.30 level or a consolidation above $5.00 as a base for the next rally toward $6.75.
Disclaimer: This analysis is for educational purposes only and does not constitute financial advice.
Trade ativo
**📌 Update April 18, 2026**The blueprint continues to execute. Here is the latest read on the structure.
Since the original breakout post, SIDU entered a full Parabolic Run phase, detaching from all moving averages - a classic sign of institutional momentum taking control. The stock closed above the Supply Zone (the yellow rectangle, $4.20–$5.20) on heavy volume, confirming that smart money absorbed the overhead supply rather than selling into it.
The $5.40–$5.50 zone has now completed a textbook S/R Flip - what was months of resistance is now concrete support (the ceiling of the yellow rectangle becomes the floor).
SIDU tagged $5.99 and pulled back - not a sign of weakness, but a natural reaction to the psychological $6.00 barrier. The handle of the Cup & Handle is forming right here, right now.
Measured Move Targets - Two Projections:
Target 1 (conservative): $6.95 - based on the inner cup depth of $2.59 projected from the breakout zone (+70.54%)
Target 2 (full cup projection): $9.64 - based on the full cup depth of $4.32 from the $1.00 low (+80.53%)
Key levels to watch:
A clean close above $6.00 on volume triggers the move toward Target 1. $5.40–$5.50 is now the support floor- any retest of this zone is a gift, not a warning. Stop for active positions: $4.75.
The thesis remains fully intact. The cup is complete. The handle is forming. Waiting for the trigger.
Disclaimer: This analysis is for educational purposes only and does not constitute financial advice.

Aviso legal
As informações e publicações não se destinam a ser, e não constituem, conselhos ou recomendações financeiras, de investimento, comerciais ou de outro tipo fornecidos ou endossados pela TradingView. Leia mais nos Termos de Uso.
Aviso legal
As informações e publicações não se destinam a ser, e não constituem, conselhos ou recomendações financeiras, de investimento, comerciais ou de outro tipo fornecidos ou endossados pela TradingView. Leia mais nos Termos de Uso.