
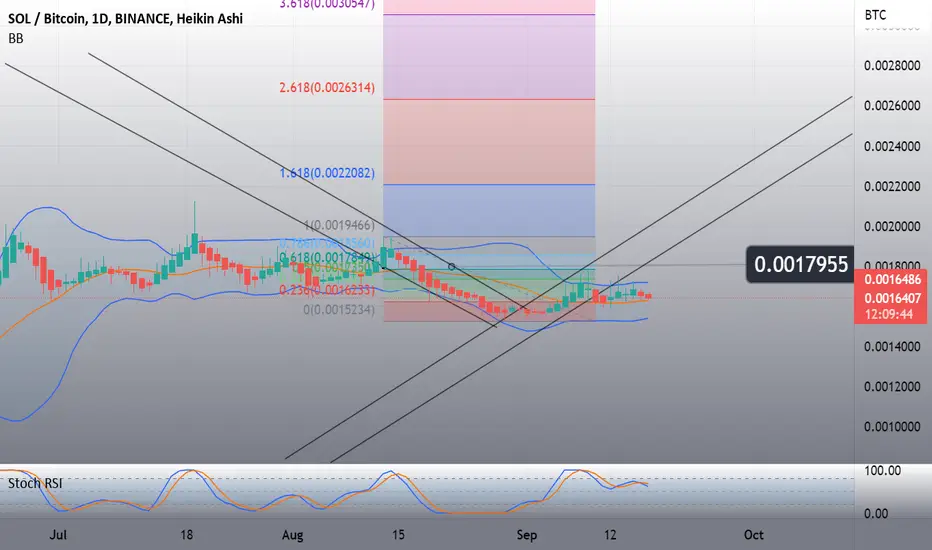
SOL BTC after breaking out of LTB was seen bouncing back on its daily chart with a 12% gain between the 4th and 9th of September, entering a new accumulation phase. The width of the Bollinger Bands on the chart confirms this accumulation and suggests an upward explosion of the asset due to the devaluation it is currently in. However, its RSI is crossed and pointed downwards, but that doesn't take away from the brute force of Sol. I believe that in the next 24 hours it reaches the target of 0.0017955.

Renato Ulianov | Market Analysis & Trading
YouTube: youtube.com/@TradewithRenatoUlianov
Disclaimer: All content is for educational and informational purposes only and does not constitute financial advice.
YouTube: youtube.com/@TradewithRenatoUlianov
Disclaimer: All content is for educational and informational purposes only and does not constitute financial advice.
Aviso legal
As informações e publicações não se destinam a ser, e não constituem, conselhos ou recomendações financeiras, de investimento, comerciais ou de outro tipo fornecidos ou endossados pela TradingView. Leia mais nos Termos de Uso.
Renato Ulianov | Market Analysis & Trading
YouTube: youtube.com/@TradewithRenatoUlianov
Disclaimer: All content is for educational and informational purposes only and does not constitute financial advice.
YouTube: youtube.com/@TradewithRenatoUlianov
Disclaimer: All content is for educational and informational purposes only and does not constitute financial advice.
Aviso legal
As informações e publicações não se destinam a ser, e não constituem, conselhos ou recomendações financeiras, de investimento, comerciais ou de outro tipo fornecidos ou endossados pela TradingView. Leia mais nos Termos de Uso.