
What's good, crypto fam! 🚀
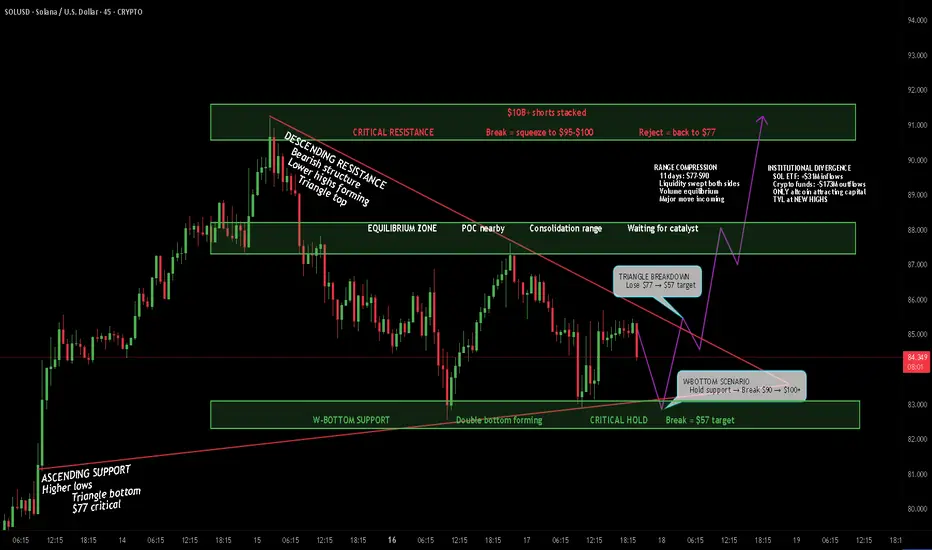
Solana is at a CRITICAL decision point right now. We've got range compression, a descending triangle pattern, and potential W-bottom formation all happening at once. Let me break down what's happening on the 45-minute chart and why the next move could be MASSIVE.
The Setup
SOLUSD is trading at $84.50 after consolidating in a tight $77-$90 range for the past 11 days. Price is squeezed between descending resistance (bearish structure) and rising support (bullish defense). We're seeing a classic compression pattern - the calm before the storm.
The big question: Does this resolve with a W-bottom reversal to $100+, or do we break down to $57?
Why This Setup Matters
- 11 days of range compression ($77-$90) - liquidity swept both sides
- Descending triangle pattern (typically bearish continuation)
- BUT - potential W-bottom forming at $77-$82 support
- Volume equilibrium = major move incoming
- $90-$92 resistance has $10B+ in short liquidations stacked
- Trading below Point of Control (POC) = slight bearish bias
- Wyckoff Reaccumulation pattern potentially in Phase D
The News Context - February 17, 2026
This is where it gets interesting - fundamentals vs technicals battle:
Bullish catalysts:
- Solana ETF inflows $31M weekly (ONLY altcoin attracting capital)
- Broader crypto funds lost $173M - SOL bucking the trend
- Total Value Locked hit NEW HIGHS despite price weakness
- Institutional experimentation expanding on Solana
- Network growth metrics remain strong
- Wyckoff reaccumulation suggests Spring at $68 completed
- Late shorts trapped around $95 (liquidation fuel above $90)
Bearish/Risk factors:
- SOL down 40% in past 30 days (dropped below $100 psychological)
- Transaction volumes spiked to 230.5M (12-month high) = cascade liquidations
- Weekly Doji Star formed = potential bearish continuation
- OBV trending sharply lower = weak buying pressure
- Trading below POC = bearish short-term bias
- Descending triangle = typically bearish pattern
- Analyst target $57 if range breaks down
- Similar pattern previously caused $250 → $125 drop
- Bitcoin marking 5th consecutive monthly loss (macro weakness)
- Fear & Greed Index at record low of 5 (extreme fear)
Key Levels I'm Watching
Resistance:
- $88 - Rising channel resistance / immediate ceiling
- $90-$92 - CRITICAL RESISTANCE ZONE (must break for bulls)
- $95 - Short liquidation cluster ($10B+)
- $100 - Psychological level / major breakout confirmation
- $102 - Extended target if breakout
- $118 - Key technical level (previous support turned resistance)
Support:
- $85 - Current price / 100-hour SMA
- $82 - First major support / 61.8% Fib
- $77-$82 - W-BOTTOM SUPPORT ZONE (critical hold)
- $76.50 - Danger zone if broken
- $72 - Extended support
- $68 - Wyckoff Spring low (must hold long-term)
- $57 - Analyst target if breakdown
- $50 - Major support if macro deteriorates
Pattern Analysis - Three Scenarios
SCENARIO 1: W-Bottom Reversal (BULLISH)
The $77-$82 zone has held twice, forming a potential W-bottom (double bottom). If this plays out:
- First bottom: $77 (left side of W)
- Second bottom: $77-$82 (right side of W - current)
- Neckline: $90-$92 resistance
- Target: $100-$118 (measured move from neckline)
Triggers: Hold $77-$82 support, break above $90-$92 with volume, short squeeze to $95-$100.
This aligns with Wyckoff Reaccumulation Phase D - if SOL holds above $95, we get Sign of Strength (SOS) rally toward $150+.
SCENARIO 2: Descending Triangle Breakdown (BEARISH)
The descending resistance from highs + horizontal support at $77 forms a descending triangle (bearish continuation pattern). If this plays out:
- Break below $77 support
- Target: $57 (measured move from triangle height)
- Potential cascade to $50 if panic selling
Triggers: Lose $77 support, volume spike on breakdown, Bitcoin breaks key support, macro deterioration.
This aligns with weekly Doji Star bearish continuation - similar to previous $250 → $125 drop.
SCENARIO 3: Range Continuation (NEUTRAL)
Price continues chopping between $77-$90 until a major catalyst forces resolution. This is liquidity-driven consolidation.
- Chop between $77-$90 for days/weeks
- Low volume, tight range
- Waiting for Bitcoin direction or major news
Triggers: No major catalyst, Bitcoin sideways, continued equilibrium.
Volume & Liquidity Analysis
- Transaction volumes hit 230.5M (12-month high) when SOL dropped below $100
- This confirms $100 and $118 as critical technical levels
- $90-$92 has $10B+ in short liquidations stacked (heatmap data)
- If SOL pushes into $90-$92, shorts get squeezed → fast spike to $95-$100
- These are "late shorts" trapped above current price
- Market Makers could wipe out shorts if Bitcoin shows strength
- BUT - OBV trending lower = weak buying pressure overall
Wyckoff Reaccumulation Context
According to Wyckoff analysis, SOL may be in Phase D of reaccumulation:
- Phase A: Selling Climax at $110 (Aug 2024), Automatic Rally to $264
- Phase B: Multiple Secondary Tests, Upthrust After at $295 (fakeout)
- Phase C: Spring at $68 (early 2026) - liquidity sweep, sharp rejection
- Phase D (NOW?): Must hold above $95 for Sign of Strength rally
If Wyckoff plays out:
- Last Point of Support (LPS): $150
- Backup (BU/LPS): $250
- Markup phase: $350-$500+
BUT this requires SOL to defend $77-$82 and break above $95 with conviction.
My Game Plan
Bullish scenario: If SOL holds the $77-$82 W-bottom support and breaks above $90-$92 with volume, we could see a rapid short squeeze to $95-$100. The ETF inflows are REAL ($31M weekly while everything else bleeds), and institutional interest is building. If Bitcoin stabilizes and SOL reclaims $95, the Wyckoff reaccumulation thesis activates → target $118, then $150+.
Bearish scenario: If we lose $77 support, the descending triangle completes and we're heading to $57. The weekly Doji Star + declining OBV + macro weakness (Bitcoin 5th red month, Fear Index at 5) suggest more pain possible. Transaction volume spike at $100 breakdown = cascade liquidations. Break $77 = danger zone.
Most likely scenario: I think we chop between $77-$90 for a bit longer while Bitcoin decides direction. The $90-$92 level is LOADED with shorts ($10B+), so any push there triggers volatility. Watch for volume spike - that's your signal. If we hold $77 = accumulation. If we break $77 = run.
The Bottom Line
I'm NEUTRAL with a slight BULLISH bias on fundamentals but CAUTIOUS on technicals.
The fundamentals are strong:
- ONLY altcoin with positive ETF inflows ($31M)
- TVL at new highs despite price weakness
- Institutional interest growing
- Wyckoff reaccumulation potentially setting up
BUT the technicals are weak:
- Descending triangle (bearish pattern)
- Trading below POC
- OBV declining
- Macro environment brutal (Bitcoin 5th red month)
The $77-$82 support zone is EVERYTHING. Hold = W-bottom to $100+. Break = Triangle breakdown to $57.
The $90-$92 resistance is the KEY. Break above = short squeeze to $95-$100+. Reject = back to $77.
What do you think? W-bottom reversal or triangle breakdown? Drop your take! 👇
If this helped, smash that 🚀 Boost button!
Not financial advice. DYOR.

The AI Trading Ecosystem, Built to win trades 📈
Get Full Access 👇
jackofalltrades.vip 🌐
t.me/jackofalltradesvip 🃏
Get Full Access 👇
jackofalltrades.vip 🌐
t.me/jackofalltradesvip 🃏
Aviso legal
As informações e publicações não se destinam a ser, e não constituem, conselhos ou recomendações financeiras, de investimento, comerciais ou de outro tipo fornecidos ou endossados pela TradingView. Leia mais nos Termos de Uso.
The AI Trading Ecosystem, Built to win trades 📈
Get Full Access 👇
jackofalltrades.vip 🌐
t.me/jackofalltradesvip 🃏
Get Full Access 👇
jackofalltrades.vip 🌐
t.me/jackofalltradesvip 🃏
Aviso legal
As informações e publicações não se destinam a ser, e não constituem, conselhos ou recomendações financeiras, de investimento, comerciais ou de outro tipo fornecidos ou endossados pela TradingView. Leia mais nos Termos de Uso.