
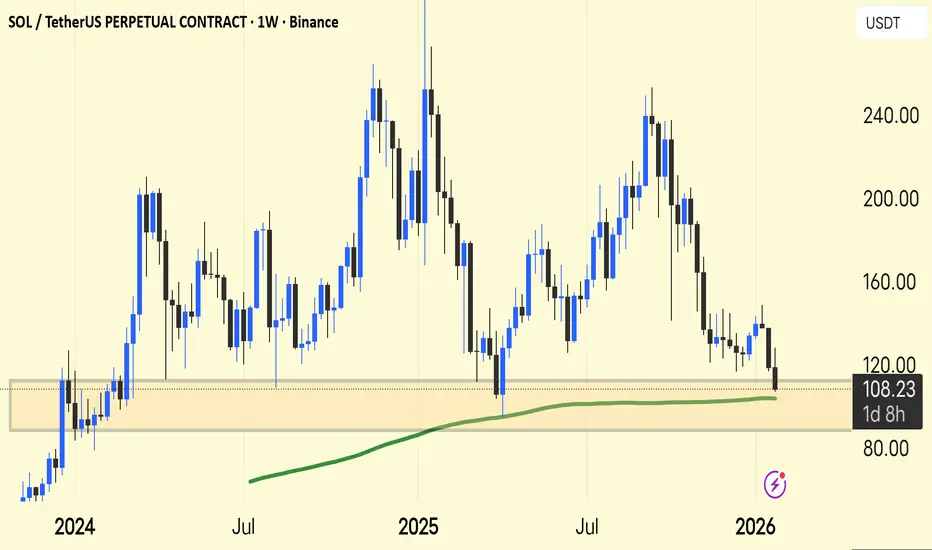
SOL/USDT — Weekly Chart Update
SOL is testing a major demand zone around $100–110, right where price has reacted multiple times before.
The 200-week MA (green) is just below price — a key long-term support area.
Market structure is still lower highs after the $240 peak → medium-term pressure remains.
Hold above $100 = base building & potential bounce toward $130–150.
Weekly close below $100 = risk of deeper pullback toward $80–90.
Summary: This is a make-or-break zone for SOL. Bulls need to defend here to flip momentum.
SOL is testing a major demand zone around $100–110, right where price has reacted multiple times before.
The 200-week MA (green) is just below price — a key long-term support area.
Market structure is still lower highs after the $240 peak → medium-term pressure remains.
Hold above $100 = base building & potential bounce toward $130–150.
Weekly close below $100 = risk of deeper pullback toward $80–90.
Summary: This is a make-or-break zone for SOL. Bulls need to defend here to flip momentum.

Publicações relacionadas
Aviso legal
As informações e publicações não se destinam a ser, e não constituem, conselhos ou recomendações financeiras, de investimento, comerciais ou de outro tipo fornecidos ou endossados pela TradingView. Leia mais nos Termos de Uso.
Publicações relacionadas
Aviso legal
As informações e publicações não se destinam a ser, e não constituem, conselhos ou recomendações financeiras, de investimento, comerciais ou de outro tipo fornecidos ou endossados pela TradingView. Leia mais nos Termos de Uso.