
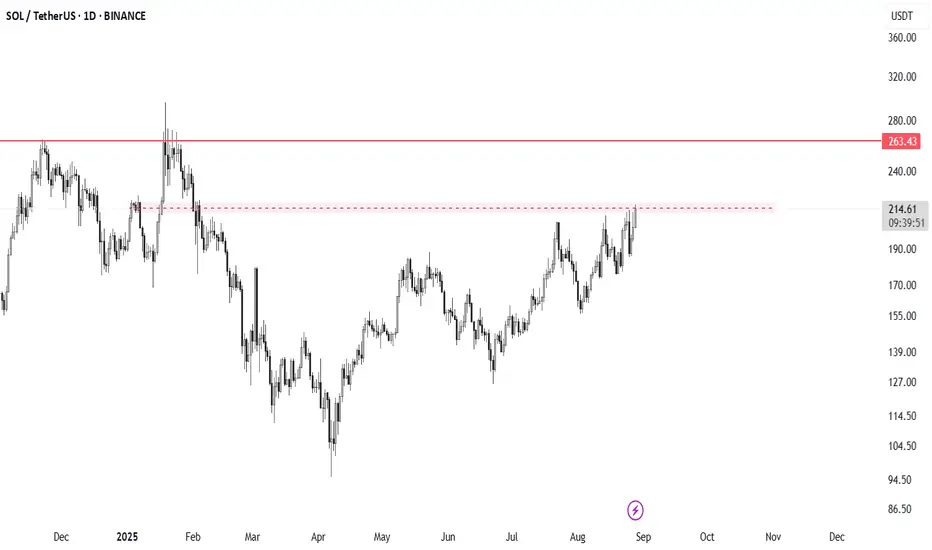
Price is currently trading around $214, right below a strong resistance zone near $230–$235. In the past, this level acted as supply, pushing the price down.
The chart shows a short setup with a stop loss above resistance and a target around $130, which is the next strong support area.
In simple terms:
If the price fails to break above $230, it could drop towards $130.
If it breaks and closes strongly above $230, the bearish setup becomes invalid, and the next resistance is around $263.
This setup is based on the idea that price is retesting an important resistance after a big rally.

Publicações relacionadas
Aviso legal
As informações e publicações não se destinam a ser, e não constituem, conselhos ou recomendações financeiras, de investimento, comerciais ou de outro tipo fornecidos ou endossados pela TradingView. Leia mais nos Termos de Uso.
Aviso legal
As informações e publicações não se destinam a ser, e não constituem, conselhos ou recomendações financeiras, de investimento, comerciais ou de outro tipo fornecidos ou endossados pela TradingView. Leia mais nos Termos de Uso.