
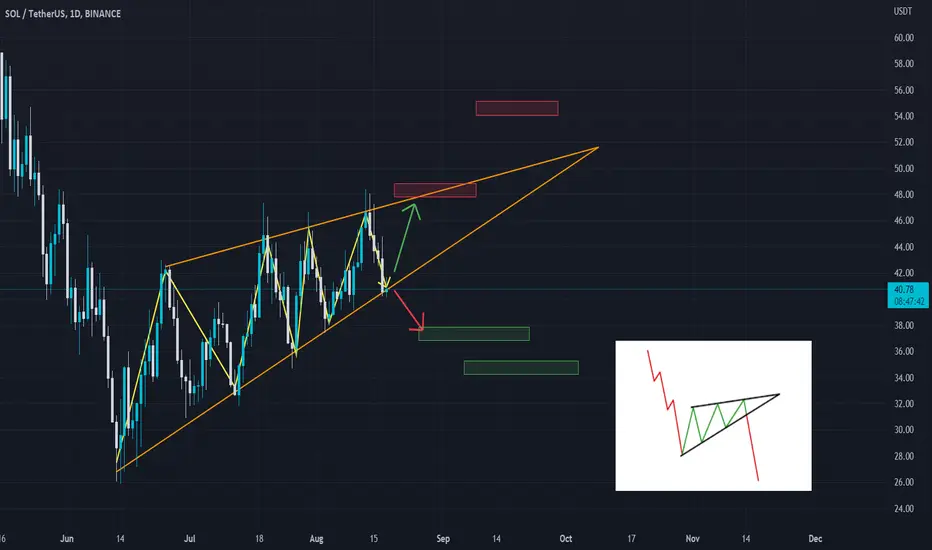
SOL/USDT is making a rising wedge pattern on 1 day chart.
There can be 2 scenarios:
1. If SOL breakout through the lower trend line below 40 then the targets are on next support areas marked on the chart (Green)
2. If SOL holds the area in the wedge then the targets are on next resistance areas marked on the chart (Red)
Share your views in the comment section.
Like & follow for more easy and simple trading ideas.
Thank You!
There can be 2 scenarios:
1. If SOL breakout through the lower trend line below 40 then the targets are on next support areas marked on the chart (Green)
2. If SOL holds the area in the wedge then the targets are on next resistance areas marked on the chart (Red)
Share your views in the comment section.
Like & follow for more easy and simple trading ideas.
Thank You!
Trade fechado: objetivo atingido
SOL closed the candle below the trend line around 23:15 UTC (18 Aug), & 1st scenario initiated.Both the targets from downward movement were achieved.
That was a sharp trade, achieving its target points really quickly.
Don't forget to like & follow for more.

Aviso legal
As informações e publicações não se destinam a ser, e não constituem, conselhos ou recomendações financeiras, de investimento, comerciais ou de outro tipo fornecidos ou endossados pela TradingView. Leia mais nos Termos de Uso.
Aviso legal
As informações e publicações não se destinam a ser, e não constituem, conselhos ou recomendações financeiras, de investimento, comerciais ou de outro tipo fornecidos ou endossados pela TradingView. Leia mais nos Termos de Uso.