
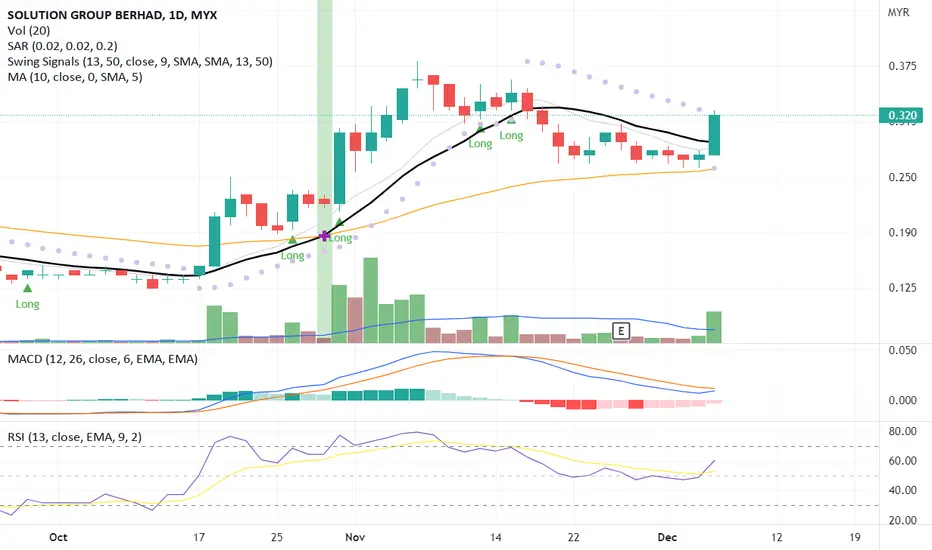
The candlestick pattern indicates a price breakout signal right above the MA13 line due to significant price movement backed by high volume.
The MACD and RSI also show a positive reading which indicates a divergence signal.
Let's SOLUTN in WL and watch out for significant price movement toward the next price resistance.
R 0.380
S 0.270
The MACD and RSI also show a positive reading which indicates a divergence signal.
Let's SOLUTN in WL and watch out for significant price movement toward the next price resistance.
R 0.380
S 0.270

Aviso legal
As informações e publicações não se destinam a ser, e não constituem, conselhos ou recomendações financeiras, de investimento, comerciais ou de outro tipo fornecidos ou endossados pela TradingView. Leia mais nos Termos de Uso.
Aviso legal
As informações e publicações não se destinam a ser, e não constituem, conselhos ou recomendações financeiras, de investimento, comerciais ou de outro tipo fornecidos ou endossados pela TradingView. Leia mais nos Termos de Uso.