 SPACE / TetherUS PERPETUAL CONTRACTAtualizado
 SPACE/USDT: 41% Parabolic Bounce With Shorts Getting Liquidated
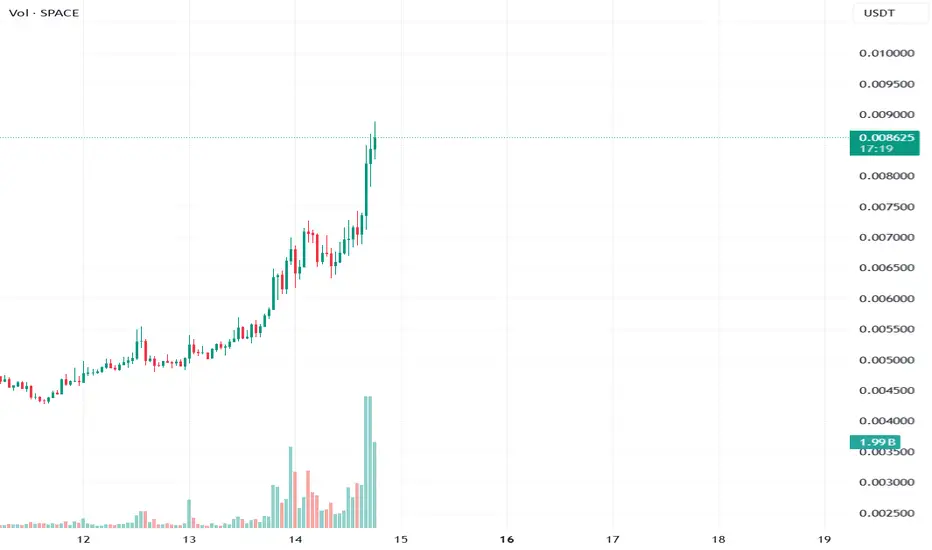
SPACE/USDT: 41% Parabolic Bounce With Shorts Getting Liquidated — But Futures Speculation Is Driving the Bus
Overview
SPACEUSDT is in full parabolic mode. A 41.3% bounce at 17.1x magnitude, a Deep BULL bias at 62.96% with an 81:19 directional split, 13:1 candlestick dominance, a price squeeze that just fired, and shorts actively getting liquidated. On the surface, this looks like an unstoppable freight train. But underneath the price action, the volume structure reveals a critical vulnerability: futures speculation is running at 10.49x spot activity, the futures Z-score is at 2.62σ (Very High) while spot is a flat -0.41σ, and the premium is volatile and unstable. This is a leveraged momentum event with real liquidation fuel — powerful but fragile.
Price Structure
Spot trades at 0.008762 with futures at 0.008744 — a -0.22% backwardation with a Z-score of -1.6. This is a meaningful premium reading. The negative Z-score at -1.6σ means futures are trading below spot by a statistically significant margin, which in a parabolic rally typically indicates heavy short positioning being squeezed — consistent with the active shorts liquidation detected on the chart.
The premium standard deviation is at 0.11%, classified as Volatile on both short and long lookbacks. This is important context: the basis between spot and futures is not just wide but unstable, swinging rapidly. Volatile premium during a parabolic move signals aggressive repositioning in the derivatives market.
The mean Z sits at 0.02σ — essentially at its historical norm. Despite the -1.6 Z-score on the premium itself, the mean reversion metric hasn't drifted far. This suggests the backwardation is a temporary dislocation driven by the liquidation event rather than a structural shift.
Yield reads -238% APY at -1.6σ — an extreme reading that screams bullish from a funding perspective. At this yield level, the cost of holding a short position is enormous, which creates additional upward pressure as shorts are forced to cover.
The bounce at 41.3% with 17.1x magnitude is classified as Parabolic. The retrace is -2.4%, which is remarkably shallow for a move of this size. Price is sitting in a demand zone. The combination of a parabolic bounce, shallow retrace, and active liquidation creates a self-reinforcing feedback loop — rising price forces shorts to cover, which pushes price higher, which forces more shorts to cover.
Multi-Timeframe Directional Bias
The bias reads Deep BULL (62.96%) — the strongest classification — with an 81% bull : 19% bear split. Total signal count: 47 bull : 17 bear out of 122 evaluated. The spread is 46.9%, classified as Strong. Clarity at 48% reflects the volatile nature of the move rather than signal disagreement.
Close vs Tenkan: 11:3 — decisively bullish. Price is closing above the Tenkan-sen on the vast majority of timeframes.
The component breakdown is overwhelmingly one-sided:
EMA alignment: 5:3 bullish. The trend structure has turned. Moving averages are now favoring buyers on the majority of timeframes — a lagging confirmation that the parabolic move has begun to reshape the broader trend.
Ichimoku TK crosses: 10:3 bullish. Near-total dominance. The cloud structure across timeframes is firmly in bull territory.
Candlestick patterns: 13:1 bullish. This is an extreme reading. On 13 out of 14 timeframes producing signals, the candle structure favors bulls. One bearish signal exists in isolation.
Pattern detail: 4 bullish 3-soldier patterns, 0 bearish. 1 bullish engulfing, 0 bearish. Pattern total: 4:0. Four separate timeframes are printing 3-soldier patterns — the most aggressive bullish continuation pattern. This is not a single-timeframe anomaly; it's a synchronized bullish cascade across the timeframe spectrum.
The price squeeze has FIRED with bandwidth at 35.56% — this is an already-expanded reading, confirming the squeeze resolved into the parabolic move. Momentum reads Bull ↑ (bullish and rising). The squeeze fire, parabolic expansion, and rising momentum are all aligned.
Zero bearish reversal patterns. Zero stars, zero harami. The bear case has no candlestick structure to lean on.
Volume Intelligence — The Structural Vulnerability
This is where the picture gets more complex.
Spot Z-score: -0.41 (Steady — slightly below average, unremarkable)
Futures Z-score: 2.62 (Very High — extreme, nearly 3 standard deviations above mean)
Combined Z-score: 0.57 (Active — pulled up entirely by futures)
Futures-to-Spot ratio: 10.49x — classified as High.
The market is classified as Futures Speculative. The dollar volumes tell the story: spot is running at $14.98M while futures sits at $157.06M. The futures market is generating over 10x the dollar volume of spot.
This isn't in the manipulation territory we sometimes see (100x+), but 10.49x with a High classification means the price move is predominantly driven by derivatives speculation rather than spot accumulation. The parabolic bounce is being fueled by leverage, not real buying of the underlying asset.
Bull:Bear volume Z-scores read 1.21 : -0.59. This is the one positive note in the volume structure — bullish volume is running above average (1.21σ) while bearish volume is suppressed (-0.59σ). The bulls that are participating are doing so with conviction, even if most of that conviction lives in the futures market.
Volume momentum is at -0.05 and falling — barely negative, but the declining trajectory suggests the speculative fervor may be peaking rather than building. Volume direction is Neutral despite the parabolic price move.
The liquidation map shows active Shorts Liquidation. This is the fuel source for the rally. As price pushes higher, short positions hit their liquidation levels, triggering forced buying that accelerates the move. The -238% APY yield and -1.6 Z-score premium confirm that shorts are under extreme pressure.
No volume squeeze on either spot or futures — the expansion is already underway. Squeeze momentum is expanding at 158.6% on the downside (contracting from previous squeeze levels), which is normal during a breakout phase.
No whale activity detected. The ceiling sits at 15.78σ — ample room for further volume expansion.
Supply/Demand Context
There are 7 supply zones overhead versus 3 demand zones below. The current price sits in a demand zone. The 7:3 ratio means resistance exists above, but the parabolic momentum and active liquidations have the potential to punch through supply zones rapidly — liquidation cascades don't respect technical resistance the way organic selling does.
The Core Analysis
This setup has a clear narrative: a legitimately powerful directional move (Deep BULL, 81:19, 13:1 candles, 4 three-soldiers, squeeze fired, shorts liquidating) that is structurally dependent on leveraged speculation (10.49x F/S ratio, futures at 2.62σ vs spot at -0.41σ, Futures Speculative classification).
The bullish case is supported by everything visible on the chart — bias, patterns, momentum, price squeeze, premium yield, liquidation pressure. It's one of the strongest multi-timeframe directional readings possible.
The risk is entirely structural. When a 41% parabolic move is backed by 10.49x futures-to-spot leverage rather than spot accumulation, the sustainability question isn't about direction — it's about what happens when the liquidation fuel runs out. Once the shorts have been cleared, the buying pressure from forced covering evaporates, and the market needs real spot demand to sustain the elevated price level. With spot Z at -0.41 (below average), that demand isn't evident yet.
Volatile premium (0.11% StdDev on both lookbacks) adds another layer of risk — the basis is swinging rapidly, which means the derivatives market is in a state of flux. Volatile premium during a parabolic move often precedes a premium normalization event, which can coincide with price retracement.
Scenarios
Scenario 1 — Liquidation Cascade Continues, Price Extends (~40% probability):
The shorts liquidation event hasn't fully cleared. More short positions hit their stops at higher price levels, creating a cascading effect that drives price through supply zones. The -238% APY yield makes holding shorts prohibitively expensive, forcing remaining bears to capitulate. Spot volume eventually follows (Z climbing from -0.41 toward 0.5+), validating the move. The 4 three-soldier patterns across timeframes prove correct as continuation signals. The parabolic structure extends before eventually exhausting.
Key confirmation: Spot Z climbing above 0 (real buyers entering), the F/S ratio compressing below 8x (spot catching up), and premium StdDev declining from Volatile toward Normal (basis stabilizing).
Scenario 2 — Liquidation Fuel Exhausts, Sharp Retracement (~35% probability):
The shorts get fully liquidated — the fuel runs out. With spot volume running below average (-0.41σ) and the entire move backed by 10.49x futures leverage, there are insufficient real buyers to hold the elevated price. Premium volatility (0.11%) triggers a normalization event. The 41% parabolic bounce retraces 30-50% of its range in a rapid correction as the leveraged structure unwinds. Futures Z collapses from 2.62σ as speculative positions close. The 3 demand zones below provide stepping stones for the correction, but the violence of a leverage unwind can blow through multiple zones.
Key warning: Futures Z declining while spot Z stays flat or falls — this is the leverage exiting. Volume momentum (-0.05, already falling) accelerating to the downside. Premium Z-score (-1.6) snapping back toward 0 rapidly.
Scenario 3 — Transition From Speculative to Structural (~25% probability):
The best-case outcome for bulls. The parabolic phase ends with a controlled consolidation rather than a sharp reversal. Spot volume gradually enters (Z climbing from -0.41 toward Average), the F/S ratio normalizes from 10.49x toward a healthier 4-6x range, and premium StdDev settles from Volatile to Normal. Price gives back 10-15% of the move but holds above key demand, establishing a new structural base. The Deep BULL bias (81:19) and 13:1 candle structure provide the foundation for a more sustainable continuation at a later stage.
Key indicator: F/S ratio declining gradually (not collapsing) while price retraces modestly. Premium StdDev moving from Volatile to Normal over multiple sessions. Spot Z climbing even as futures Z declines — a handoff from speculation to accumulation.
What to Watch
Primary trigger: The shorts liquidation status. When the "Shorts Liq" signal clears, the forced buying pressure disappears. What price does immediately after liquidations clear is the single most telling signal. If it holds — Scenario 1 or 3. If it drops — Scenario 2.
Spot participation: The Spot Z at -0.41 is the structural weak link. A parabolic move needs real buyers to sustain. Watch for Spot Z to cross above 0 — that's the signal that spot demand is validating the futures-driven move.
Premium stability: The volatile StdDev (0.11% on both lookbacks) needs to settle. Declining premium volatility alongside stable price = the market is finding equilibrium. Increasing premium volatility = more instability ahead.
F/S Ratio trajectory: 10.49x is High but not Manipulation level. If it compresses toward 6x with price holding, the structure is improving. If it climbs above 15x, the speculative excess is worsening.
Volume momentum: Currently -0.05 and falling. This needs to stabilize or turn positive for the move to sustain. A deepening decline in volume momentum during a parabolic move = the participation peak has passed.
Risk Note
A 41% parabolic bounce driven by 10.49x futures leverage, active shorts liquidation, -238% APY yield, volatile premium, and below-average spot participation creates a high-reward but structurally fragile setup. The directional signals are among the strongest possible (Deep BULL, 81:19, 13:1 candles, 4 three-soldiers), but the volume microstructure reveals that this move is built on derivatives speculation and forced liquidation rather than organic spot demand. Parabolic moves end — the question is whether they transition or collapse. Position sizing should account for the leveraged fragility, and risk management is critical during active liquidation events. Educational analysis only — not financial advice.
TAGS
SPACE SPACEUSDT Volume Analysis Squeeze Technical Analysis Supply and Demand Multi-Timeframe Analysis Crypto Futures Liquidation
Overview
SPACEUSDT is in full parabolic mode. A 41.3% bounce at 17.1x magnitude, a Deep BULL bias at 62.96% with an 81:19 directional split, 13:1 candlestick dominance, a price squeeze that just fired, and shorts actively getting liquidated. On the surface, this looks like an unstoppable freight train. But underneath the price action, the volume structure reveals a critical vulnerability: futures speculation is running at 10.49x spot activity, the futures Z-score is at 2.62σ (Very High) while spot is a flat -0.41σ, and the premium is volatile and unstable. This is a leveraged momentum event with real liquidation fuel — powerful but fragile.
Price Structure
Spot trades at 0.008762 with futures at 0.008744 — a -0.22% backwardation with a Z-score of -1.6. This is a meaningful premium reading. The negative Z-score at -1.6σ means futures are trading below spot by a statistically significant margin, which in a parabolic rally typically indicates heavy short positioning being squeezed — consistent with the active shorts liquidation detected on the chart.
The premium standard deviation is at 0.11%, classified as Volatile on both short and long lookbacks. This is important context: the basis between spot and futures is not just wide but unstable, swinging rapidly. Volatile premium during a parabolic move signals aggressive repositioning in the derivatives market.
The mean Z sits at 0.02σ — essentially at its historical norm. Despite the -1.6 Z-score on the premium itself, the mean reversion metric hasn't drifted far. This suggests the backwardation is a temporary dislocation driven by the liquidation event rather than a structural shift.
Yield reads -238% APY at -1.6σ — an extreme reading that screams bullish from a funding perspective. At this yield level, the cost of holding a short position is enormous, which creates additional upward pressure as shorts are forced to cover.
The bounce at 41.3% with 17.1x magnitude is classified as Parabolic. The retrace is -2.4%, which is remarkably shallow for a move of this size. Price is sitting in a demand zone. The combination of a parabolic bounce, shallow retrace, and active liquidation creates a self-reinforcing feedback loop — rising price forces shorts to cover, which pushes price higher, which forces more shorts to cover.
Multi-Timeframe Directional Bias
The bias reads Deep BULL (62.96%) — the strongest classification — with an 81% bull : 19% bear split. Total signal count: 47 bull : 17 bear out of 122 evaluated. The spread is 46.9%, classified as Strong. Clarity at 48% reflects the volatile nature of the move rather than signal disagreement.
Close vs Tenkan: 11:3 — decisively bullish. Price is closing above the Tenkan-sen on the vast majority of timeframes.
The component breakdown is overwhelmingly one-sided:
EMA alignment: 5:3 bullish. The trend structure has turned. Moving averages are now favoring buyers on the majority of timeframes — a lagging confirmation that the parabolic move has begun to reshape the broader trend.
Ichimoku TK crosses: 10:3 bullish. Near-total dominance. The cloud structure across timeframes is firmly in bull territory.
Candlestick patterns: 13:1 bullish. This is an extreme reading. On 13 out of 14 timeframes producing signals, the candle structure favors bulls. One bearish signal exists in isolation.
Pattern detail: 4 bullish 3-soldier patterns, 0 bearish. 1 bullish engulfing, 0 bearish. Pattern total: 4:0. Four separate timeframes are printing 3-soldier patterns — the most aggressive bullish continuation pattern. This is not a single-timeframe anomaly; it's a synchronized bullish cascade across the timeframe spectrum.
The price squeeze has FIRED with bandwidth at 35.56% — this is an already-expanded reading, confirming the squeeze resolved into the parabolic move. Momentum reads Bull ↑ (bullish and rising). The squeeze fire, parabolic expansion, and rising momentum are all aligned.
Zero bearish reversal patterns. Zero stars, zero harami. The bear case has no candlestick structure to lean on.
Volume Intelligence — The Structural Vulnerability
This is where the picture gets more complex.
Spot Z-score: -0.41 (Steady — slightly below average, unremarkable)
Futures Z-score: 2.62 (Very High — extreme, nearly 3 standard deviations above mean)
Combined Z-score: 0.57 (Active — pulled up entirely by futures)
Futures-to-Spot ratio: 10.49x — classified as High.
The market is classified as Futures Speculative. The dollar volumes tell the story: spot is running at $14.98M while futures sits at $157.06M. The futures market is generating over 10x the dollar volume of spot.
This isn't in the manipulation territory we sometimes see (100x+), but 10.49x with a High classification means the price move is predominantly driven by derivatives speculation rather than spot accumulation. The parabolic bounce is being fueled by leverage, not real buying of the underlying asset.
Bull:Bear volume Z-scores read 1.21 : -0.59. This is the one positive note in the volume structure — bullish volume is running above average (1.21σ) while bearish volume is suppressed (-0.59σ). The bulls that are participating are doing so with conviction, even if most of that conviction lives in the futures market.
Volume momentum is at -0.05 and falling — barely negative, but the declining trajectory suggests the speculative fervor may be peaking rather than building. Volume direction is Neutral despite the parabolic price move.
The liquidation map shows active Shorts Liquidation. This is the fuel source for the rally. As price pushes higher, short positions hit their liquidation levels, triggering forced buying that accelerates the move. The -238% APY yield and -1.6 Z-score premium confirm that shorts are under extreme pressure.
No volume squeeze on either spot or futures — the expansion is already underway. Squeeze momentum is expanding at 158.6% on the downside (contracting from previous squeeze levels), which is normal during a breakout phase.
No whale activity detected. The ceiling sits at 15.78σ — ample room for further volume expansion.
Supply/Demand Context
There are 7 supply zones overhead versus 3 demand zones below. The current price sits in a demand zone. The 7:3 ratio means resistance exists above, but the parabolic momentum and active liquidations have the potential to punch through supply zones rapidly — liquidation cascades don't respect technical resistance the way organic selling does.
The Core Analysis
This setup has a clear narrative: a legitimately powerful directional move (Deep BULL, 81:19, 13:1 candles, 4 three-soldiers, squeeze fired, shorts liquidating) that is structurally dependent on leveraged speculation (10.49x F/S ratio, futures at 2.62σ vs spot at -0.41σ, Futures Speculative classification).
The bullish case is supported by everything visible on the chart — bias, patterns, momentum, price squeeze, premium yield, liquidation pressure. It's one of the strongest multi-timeframe directional readings possible.
The risk is entirely structural. When a 41% parabolic move is backed by 10.49x futures-to-spot leverage rather than spot accumulation, the sustainability question isn't about direction — it's about what happens when the liquidation fuel runs out. Once the shorts have been cleared, the buying pressure from forced covering evaporates, and the market needs real spot demand to sustain the elevated price level. With spot Z at -0.41 (below average), that demand isn't evident yet.
Volatile premium (0.11% StdDev on both lookbacks) adds another layer of risk — the basis is swinging rapidly, which means the derivatives market is in a state of flux. Volatile premium during a parabolic move often precedes a premium normalization event, which can coincide with price retracement.
Scenarios
Scenario 1 — Liquidation Cascade Continues, Price Extends (~40% probability):
The shorts liquidation event hasn't fully cleared. More short positions hit their stops at higher price levels, creating a cascading effect that drives price through supply zones. The -238% APY yield makes holding shorts prohibitively expensive, forcing remaining bears to capitulate. Spot volume eventually follows (Z climbing from -0.41 toward 0.5+), validating the move. The 4 three-soldier patterns across timeframes prove correct as continuation signals. The parabolic structure extends before eventually exhausting.
Key confirmation: Spot Z climbing above 0 (real buyers entering), the F/S ratio compressing below 8x (spot catching up), and premium StdDev declining from Volatile toward Normal (basis stabilizing).
Scenario 2 — Liquidation Fuel Exhausts, Sharp Retracement (~35% probability):
The shorts get fully liquidated — the fuel runs out. With spot volume running below average (-0.41σ) and the entire move backed by 10.49x futures leverage, there are insufficient real buyers to hold the elevated price. Premium volatility (0.11%) triggers a normalization event. The 41% parabolic bounce retraces 30-50% of its range in a rapid correction as the leveraged structure unwinds. Futures Z collapses from 2.62σ as speculative positions close. The 3 demand zones below provide stepping stones for the correction, but the violence of a leverage unwind can blow through multiple zones.
Key warning: Futures Z declining while spot Z stays flat or falls — this is the leverage exiting. Volume momentum (-0.05, already falling) accelerating to the downside. Premium Z-score (-1.6) snapping back toward 0 rapidly.
Scenario 3 — Transition From Speculative to Structural (~25% probability):
The best-case outcome for bulls. The parabolic phase ends with a controlled consolidation rather than a sharp reversal. Spot volume gradually enters (Z climbing from -0.41 toward Average), the F/S ratio normalizes from 10.49x toward a healthier 4-6x range, and premium StdDev settles from Volatile to Normal. Price gives back 10-15% of the move but holds above key demand, establishing a new structural base. The Deep BULL bias (81:19) and 13:1 candle structure provide the foundation for a more sustainable continuation at a later stage.
Key indicator: F/S ratio declining gradually (not collapsing) while price retraces modestly. Premium StdDev moving from Volatile to Normal over multiple sessions. Spot Z climbing even as futures Z declines — a handoff from speculation to accumulation.
What to Watch
Primary trigger: The shorts liquidation status. When the "Shorts Liq" signal clears, the forced buying pressure disappears. What price does immediately after liquidations clear is the single most telling signal. If it holds — Scenario 1 or 3. If it drops — Scenario 2.
Spot participation: The Spot Z at -0.41 is the structural weak link. A parabolic move needs real buyers to sustain. Watch for Spot Z to cross above 0 — that's the signal that spot demand is validating the futures-driven move.
Premium stability: The volatile StdDev (0.11% on both lookbacks) needs to settle. Declining premium volatility alongside stable price = the market is finding equilibrium. Increasing premium volatility = more instability ahead.
F/S Ratio trajectory: 10.49x is High but not Manipulation level. If it compresses toward 6x with price holding, the structure is improving. If it climbs above 15x, the speculative excess is worsening.
Volume momentum: Currently -0.05 and falling. This needs to stabilize or turn positive for the move to sustain. A deepening decline in volume momentum during a parabolic move = the participation peak has passed.
Risk Note
A 41% parabolic bounce driven by 10.49x futures leverage, active shorts liquidation, -238% APY yield, volatile premium, and below-average spot participation creates a high-reward but structurally fragile setup. The directional signals are among the strongest possible (Deep BULL, 81:19, 13:1 candles, 4 three-soldiers), but the volume microstructure reveals that this move is built on derivatives speculation and forced liquidation rather than organic spot demand. Parabolic moves end — the question is whether they transition or collapse. Position sizing should account for the leveraged fragility, and risk management is critical during active liquidation events. Educational analysis only — not financial advice.
TAGS
SPACE SPACEUSDT Volume Analysis Squeeze Technical Analysis Supply and Demand Multi-Timeframe Analysis Crypto Futures Liquidation
Trade ativo
SPACEUSDT.P at 0.009368 has extended its parabolic run — bounce grown from 41% to 52%, bias upgraded from Deep to Extreme BULL (77.78%), EMA perfected to 6:0, Ichimoku perfected to 10:0, and shorts are getting rekt at maximum severity. But the price action is telling a different story: candles weakened from 13:1 to 11:3, three-soldiers collapsed from 4 to 1, pattern total eroded from 3:0 to 1:1, and a bearish harami has appeared for the first time. Futures leverage has intensified to Extreme (3.8σ) while spot remains flat. The spot market still doesn't exist. The trend is strengthening. The price action is weakening. The leverage is intensifying. This is late-stage parabolic anatomy.What Changed Since the Previous Analysis
The structural and lagging indicators have perfected. EMA moved from 5:3 to 6:0 — every bearish signal has flipped, making the moving average structure unanimously bullish. Ichimoku shifted from 10:3 to 10:0 — the last three bearish TK crosses have capitulated. The overall bias upgraded from Deep BULL to Extreme BULL at 77.78% with an 89:11 split, and C>T improved to 11:1. The bounce has extended from 41.3% to 51.9% at 17.8x magnitude.
But the real-time and leading indicators have deteriorated. Candlestick patterns weakened from 13:1 to 11:3 — three additional bearish signals have appeared. Three-soldier patterns collapsed from 4 to just 1, meaning three timeframes that were printing relentless bullish continuation have stopped. The pattern total eroded from 3:0 to 1:1 — bears have matched the bulls in resolved patterns. And a bearish harami has appeared for the first time in this entire rally.
On the risk side, everything has intensified. Futures Z jumped from 2.62 to 3.8 (Extreme) — approaching the statistical ceiling. The F/S ratio worsened from 10.49x to 11.73x. Liquidation status escalated from Shorts Liq to SHORT REKT. Meanwhile, spot Z sits at -0.38, virtually unchanged from -0.41 — the 52% parabolic advance has generated zero additional spot participation because no spot market exists on this exchange.
This is the textbook late-stage signature: lagging indicators perfect as they catch up to an already-completed rally, while leading indicators deteriorate as they detect real-time fatigue. The trend looks its best right before the turn.
The Critical Deterioration
The three-soldier collapse from 4 to 1 is the single most informative change. Three-soldiers require three consecutive decisive bullish candles — their presence on 4 timeframes previously meant relentless bullish progression across the timeframe spectrum. Now only 1 remains. The orderly, bar-by-bar advance that characterized the early rally phase is breaking down on most timeframes.
The bearish harami is the first concrete bearish multi-bar pattern in this entire rally. Haramis mark moments where momentum pauses and then chooses a direction — this one chose bearish. Its appearance doesn't guarantee reversal, but it's the first crack in what was previously an unblemished bullish pattern structure.
Volume — Leverage Has Intensified
Futures Z at 3.8σ Extreme is approaching the upper boundary of the statistical distribution. Dollar volumes show $219.85M in futures versus $18.74M in spot proxy. Bull volume Z has intensified from 1.21 to 1.73 — committed futures buyers are participating harder — but this is leverage-based conviction, not real accumulation. The SHORT REKT liquidation event remains the primary fuel source, and when that signal clears, the forced buying disappears immediately.
Updated Scenarios
The continuation probability has been downgraded from 40% to 25%. The candle deterioration, three-soldier collapse, and harami appearance all reduce the likelihood of sustained extension. The rally can still run on pure liquidation mechanics, but the quality of the advance has degraded. Recovery would require three-soldiers climbing back above 2, candles stabilizing, and spot Z finally crossing above zero.
The sharp correction probability has been upgraded from 35% to 50%, making it the primary scenario. Every risk metric has intensified while price action quality has deteriorated simultaneously. When liquidation fuel exhausts, the market faces no spot market, no real buyers, 3.8σ futures volume that must normalize, and candles already printing exhaustion patterns. Warning signs include candles dropping below 10:4, futures Z declining from 3.8, and bull volume Z falling from 1.73.
A controlled transition remains at 25%. The perfected EMA and Ichimoku could provide structural support for a soft landing — price giving back 15-25% in a measured correction rather than a crash, transitioning from parabolic speculation to a sustainable base. This requires the F/S ratio declining gradually rather than collapsing, candles finding a floor above 8:4, and price holding the first demand zone.
What to Watch
The candle trajectory is the top priority — a drop to 10:4 means exhaustion is accelerating. The last remaining three-soldier pattern is second — if it disappears, the continuation mechanism is dead. Futures Z at 3.8σ is third — when it begins declining, the leverage unwind has started regardless of what price is doing. The SHORT REKT liquidation status is fourth — when it clears, the fuel vanishes instantly. And the bearish harami count is fifth — a second harami would confirm the exhaustion pattern is establishing rather than a one-off anomaly.
Risk Note
The probability distribution has shifted from balanced to favoring correction at 50% versus 25% continuation. A 52% parabolic bounce on a perpetual contract with no spot pair, Extreme futures leverage at 3.8σ, collapsing three-soldiers, and a new bearish harami represents late-cycle speculation at its most fragile. The trend indicators look perfect because lagging indicators always look their best right before the turn. Educational analysis only — not financial advice.
TAGS
SPACE SPACEUSDT Volume Analysis Technical Analysis Supply and Demand Multi-Timeframe Analysis Crypto Futures Liquidation

5 TradingView Premium Indicators : Real Volume. Real Signals. 3-day free trial 👇whop.com/volume-hunter/ tiktok.com/@volume_hunter t.me/volume_hunter Forex | Stocks | ETFs | Indices | Options
Aviso legal
As informações e publicações não se destinam a ser, e não constituem, conselhos ou recomendações financeiras, de investimento, comerciais ou de outro tipo fornecidos ou endossados pela TradingView. Leia mais nos Termos de Uso.
5 TradingView Premium Indicators : Real Volume. Real Signals. 3-day free trial 👇whop.com/volume-hunter/ tiktok.com/@volume_hunter t.me/volume_hunter Forex | Stocks | ETFs | Indices | Options
Aviso legal
As informações e publicações não se destinam a ser, e não constituem, conselhos ou recomendações financeiras, de investimento, comerciais ou de outro tipo fornecidos ou endossados pela TradingView. Leia mais nos Termos de Uso.