
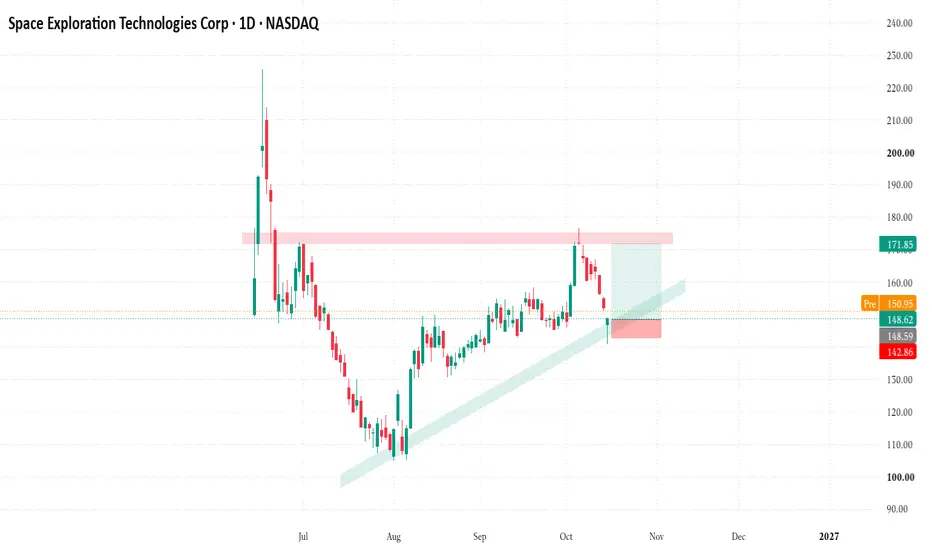
SPCX (1D) – Technical Analysis
SPCX is currently trading near $148.62 and testing an important support area.
Key Support Zone: $142.86–$148.60
Major Resistance Zone: $171–$175
Trend Structure: Ascending trendline with higher lows.
Bullish Scenario:
If the price holds above the support zone and forms a strong bullish daily candle, a move toward $155–$160 may be possible. A breakout above this area could open the way toward $165 and the major resistance zone near $171–$175.
Bearish Scenario:
If the price closes below $142.86 on the daily timeframe, selling pressure may increase. Potential support areas to monitor are $135, $130, and $120.
Confirmation: Watch daily candle closes, trading volume, and price action around the trendline.
Risk Management: Wait for confirmation before entering a trade. Define your entry, stop-loss, and risk-to-reward ratio in advance.
This analysis presents potential scenarios, not guaranteed price targets. Always manage risk and conduct your own research.
#SPCX #TechnicalAnalysis #PriceAction #TradingView
SPCX is currently trading near $148.62 and testing an important support area.
Key Support Zone: $142.86–$148.60
Major Resistance Zone: $171–$175
Trend Structure: Ascending trendline with higher lows.
Bullish Scenario:
If the price holds above the support zone and forms a strong bullish daily candle, a move toward $155–$160 may be possible. A breakout above this area could open the way toward $165 and the major resistance zone near $171–$175.
Bearish Scenario:
If the price closes below $142.86 on the daily timeframe, selling pressure may increase. Potential support areas to monitor are $135, $130, and $120.
Confirmation: Watch daily candle closes, trading volume, and price action around the trendline.
Risk Management: Wait for confirmation before entering a trade. Define your entry, stop-loss, and risk-to-reward ratio in advance.
This analysis presents potential scenarios, not guaranteed price targets. Always manage risk and conduct your own research.
#SPCX #TechnicalAnalysis #PriceAction #TradingView

Aviso legal
As informações e publicações não se destinam a ser, e não constituem, conselhos ou recomendações financeiras, de investimento, comerciais ou de outro tipo fornecidos ou endossados pela TradingView. Leia mais nos Termos de Uso.
Aviso legal
As informações e publicações não se destinam a ser, e não constituem, conselhos ou recomendações financeiras, de investimento, comerciais ou de outro tipo fornecidos ou endossados pela TradingView. Leia mais nos Termos de Uso.