
Technical Analysis and Outlook:
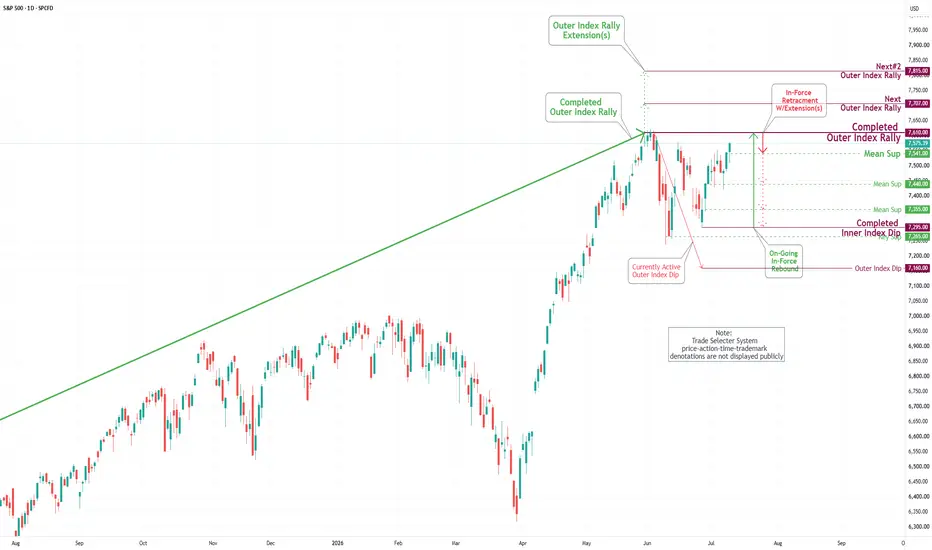
In the previous week's trading session, the S&P 500 Index posted a substantial gain after successfully retesting the Mean Support level at 7,440. This led the Index to surpass the Mean Resistance level of 7,553.
Forecasts indicate that this vital Index is likely to continue its upward trajectory, with the potential to revisit the completed Outer Index Rally at 7,610. Furthermore, there is the possibility of extending to the subsequent Outer Index Rally levels of 7,707 and 7,815.
On the other hand, there exists a significant likelihood of triggering an In-Force retracement back toward the Mean Support level at 7,440. This movement may trigger a sustained violent downward price trend, as shown in the accompanying chart.
In the previous week's trading session, the S&P 500 Index posted a substantial gain after successfully retesting the Mean Support level at 7,440. This led the Index to surpass the Mean Resistance level of 7,553.
Forecasts indicate that this vital Index is likely to continue its upward trajectory, with the potential to revisit the completed Outer Index Rally at 7,610. Furthermore, there is the possibility of extending to the subsequent Outer Index Rally levels of 7,707 and 7,815.
On the other hand, there exists a significant likelihood of triggering an In-Force retracement back toward the Mean Support level at 7,440. This movement may trigger a sustained violent downward price trend, as shown in the accompanying chart.

Publicações relacionadas
Aviso legal
As informações e publicações não se destinam a ser, e não constituem, conselhos ou recomendações financeiras, de investimento, comerciais ou de outro tipo fornecidos ou endossados pela TradingView. Leia mais nos Termos de Uso.
Publicações relacionadas
Aviso legal
As informações e publicações não se destinam a ser, e não constituem, conselhos ou recomendações financeiras, de investimento, comerciais ou de outro tipo fornecidos ou endossados pela TradingView. Leia mais nos Termos de Uso.