
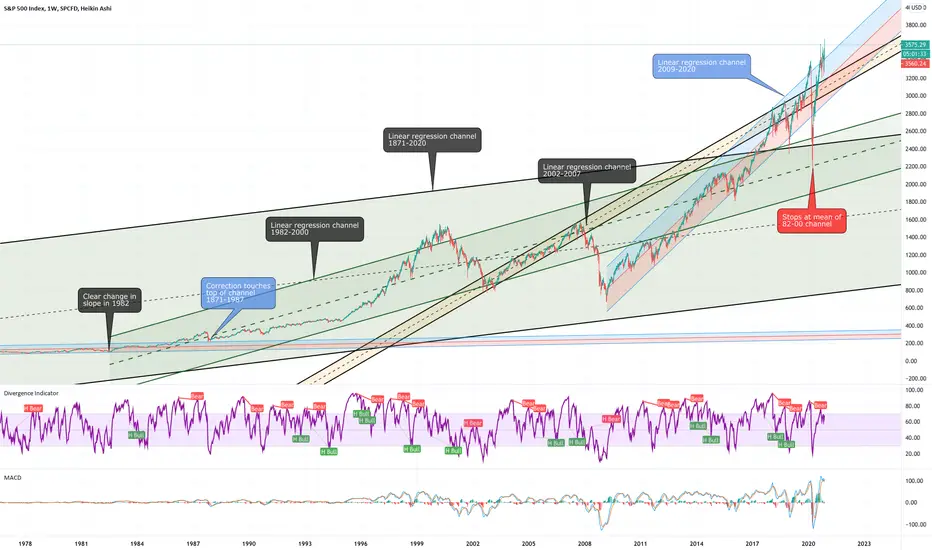
I just love finding all of these technical things that help makes sense of why the market tops and bottoms at different locations. It is all based on linear projects of previous data! Not sure how to use it to trade, but from a history perspective it is pretty cool IMO.
Here is an interesting data point. The dot com bubble was about 76% above the regression channel when it peaked. The S&P is currently at 50% above the regression channel. It does clearly make it look like the S&P is way, way overextended and clearly "bubblish." However, if the dot com bubble is the measuring stick, then we can go another 25%!!!

Just because I can when using the layer capability of trading view.

Hope it helps.
Here is an interesting data point. The dot com bubble was about 76% above the regression channel when it peaked. The S&P is currently at 50% above the regression channel. It does clearly make it look like the S&P is way, way overextended and clearly "bubblish." However, if the dot com bubble is the measuring stick, then we can go another 25%!!!
Just because I can when using the layer capability of trading view.
Hope it helps.

Publicações relacionadas
Aviso legal
As informações e publicações não se destinam a ser, e não constituem, conselhos ou recomendações financeiras, de investimento, comerciais ou de outro tipo fornecidos ou endossados pela TradingView. Leia mais nos Termos de Uso.
Publicações relacionadas
Aviso legal
As informações e publicações não se destinam a ser, e não constituem, conselhos ou recomendações financeiras, de investimento, comerciais ou de outro tipo fornecidos ou endossados pela TradingView. Leia mais nos Termos de Uso.