
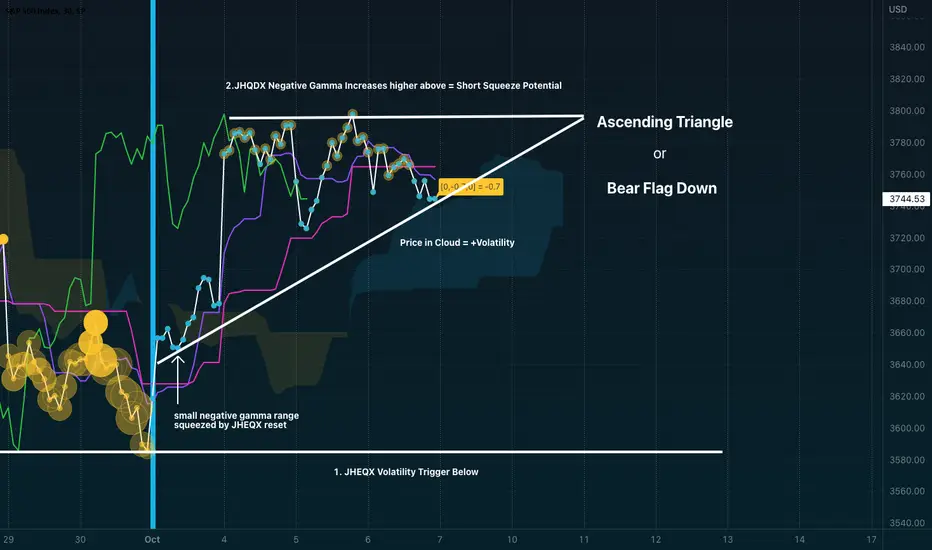
Here is the new indicator on the 30 min timeframe.
I wrote it to read daily SPX even in smaller timeframes so you can get more frequent updates on gamma and delta.
Combine with Ichimoku Cloud and some TA and you got some predictable outcomes to build hedging, swing trades or even scalping short squeeze bottoms.
Ascending Triangle is a perfect example of volatility compression.
Higher at top of triangle = Volatility
Rising lower trend line = Support
Vix is playing its part.
Below trendline = volatility compressing 🤷
Above trendline = volatility compressing 🤷
I think this sideways chop with squeezes higher or dumps overnight / AM continue until CPI on the 13th.

Publicações relacionadas
Aviso legal
As informações e publicações não se destinam a ser, e não constituem, conselhos ou recomendações financeiras, de investimento, comerciais ou de outro tipo fornecidos ou endossados pela TradingView. Leia mais nos Termos de Uso.
Publicações relacionadas
Aviso legal
As informações e publicações não se destinam a ser, e não constituem, conselhos ou recomendações financeiras, de investimento, comerciais ou de outro tipo fornecidos ou endossados pela TradingView. Leia mais nos Termos de Uso.