
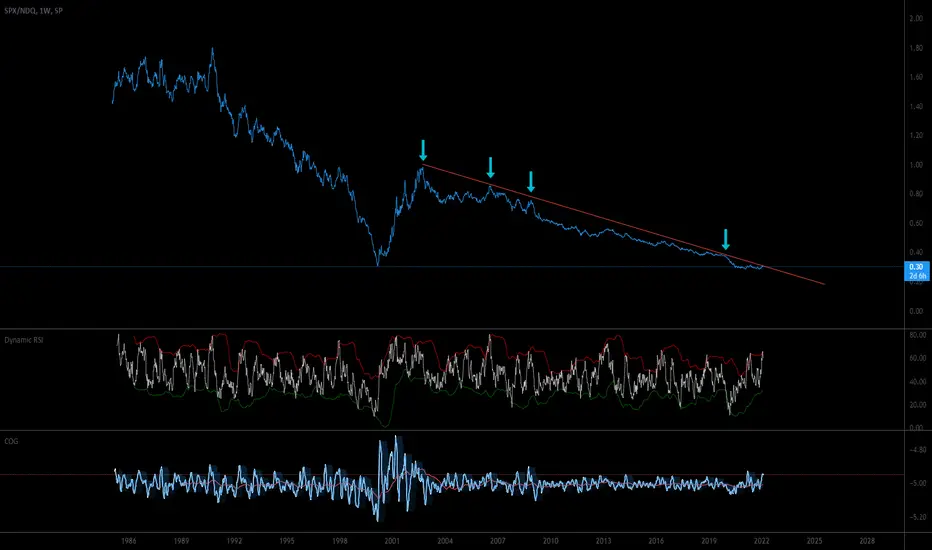
This is a fascinating chart. Since 1985, the NASDAQ 100 Index has been consistently outperforming the S&P 500 except for 2 years following the bursting of the Dot.com Bubble.
Also of note is the well-defined downtrend line that has been tested several times in the past, and is currently being tested again. The ratio is currently near the same level that marked the top of the last tech bubble peak, and is facing pressure from tightening financial conditions.
Watch this chart closely for clues to selecting asset classes that will outperform going forward.
Also of note is the well-defined downtrend line that has been tested several times in the past, and is currently being tested again. The ratio is currently near the same level that marked the top of the last tech bubble peak, and is facing pressure from tightening financial conditions.
Watch this chart closely for clues to selecting asset classes that will outperform going forward.

Aviso legal
As informações e publicações não se destinam a ser, e não constituem, conselhos ou recomendações financeiras, de investimento, comerciais ou de outro tipo fornecidos ou endossados pela TradingView. Leia mais nos Termos de Uso.
Aviso legal
As informações e publicações não se destinam a ser, e não constituem, conselhos ou recomendações financeiras, de investimento, comerciais ou de outro tipo fornecidos ou endossados pela TradingView. Leia mais nos Termos de Uso.