
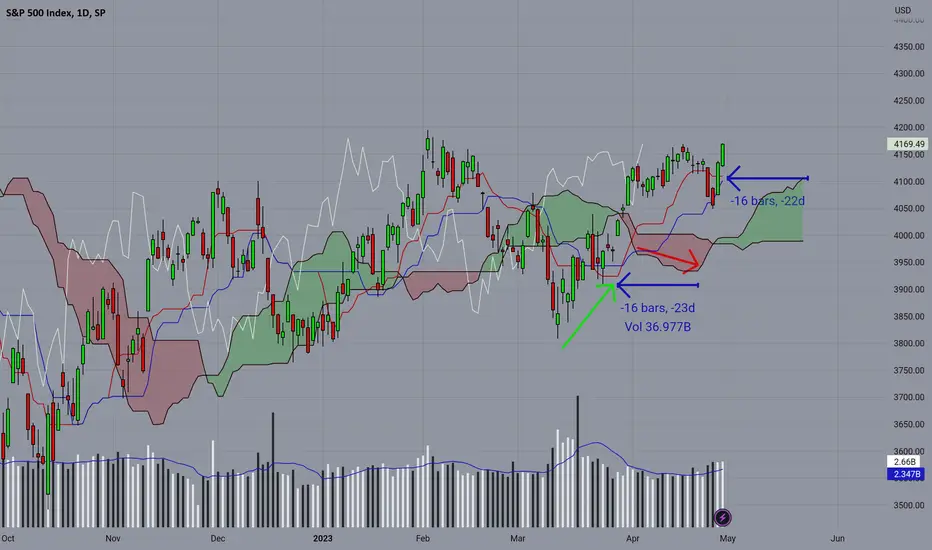
Here we have a 16 bar lag. The price breaches bearish and then beltlines bullish, and the red cloud continues bearish around the bullish low. Note: a signal for a lower low but price is a higher low is a reverse bullish signal. This example is a reverse bullish divergence signal methodology.

Aviso legal
As informações e publicações não se destinam a ser, e não constituem, conselhos ou recomendações financeiras, de investimento, comerciais ou de outro tipo fornecidos ou endossados pela TradingView. Leia mais nos Termos de Uso.
Aviso legal
As informações e publicações não se destinam a ser, e não constituem, conselhos ou recomendações financeiras, de investimento, comerciais ou de outro tipo fornecidos ou endossados pela TradingView. Leia mais nos Termos de Uso.