
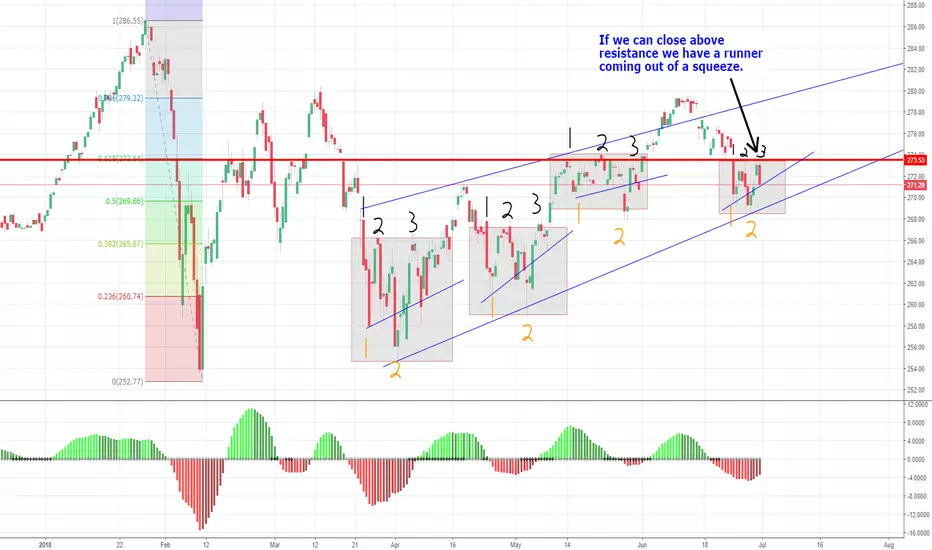
SPY 4 Hr chart shows just how many times resistance needs to get hit in order to complete an ABC sort of cycle. Multiple indicators point to the level 273.50 as current resistance. If resistance becomes support, it would send us out of a Squeeze for this 4 hour chart.

Aviso legal
As informações e publicações não se destinam a ser, e não constituem, conselhos ou recomendações financeiras, de investimento, comerciais ou de outro tipo fornecidos ou endossados pela TradingView. Leia mais nos Termos de Uso.
Aviso legal
As informações e publicações não se destinam a ser, e não constituem, conselhos ou recomendações financeiras, de investimento, comerciais ou de outro tipo fornecidos ou endossados pela TradingView. Leia mais nos Termos de Uso.