
Most traders don’t fail because they lack indicators.
They fail because they stop seeing price action.
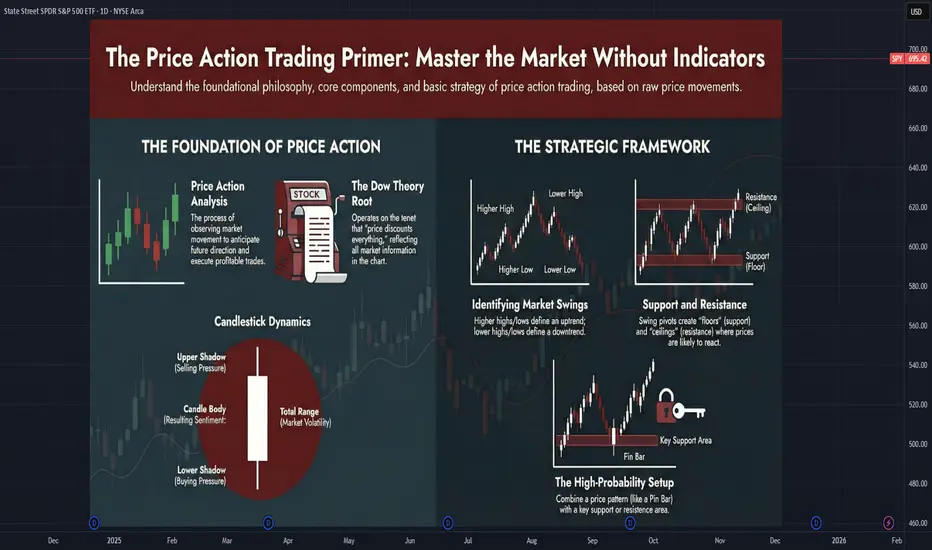
If your chart is crowded, your thinking usually is too. This post lays out five foundational truths of modern Price Action trading. There are no new patterns to memorize, but principles that simplify decision-making across any market and timeframe.
📌 TRUTH #1 — PRICE ALREADY KNOWS EVERYTHING
Modern Price Action is rooted in Dow Theory. Its most important insight is simple:
All available information—fundamentals, news, sentiment, expectations—is already reflected in price.
This shifts the trader’s role from prediction to response. Instead of asking what should happen, the price action trader asks:
What is happening right now?
Once you accept price as the final authority, the chart becomes your primary source of information.
📌 TRUTH #2 — PRICE ACTION IS A FRAMEWORK, NOT A PATTERN
Price Action is often misunderstood as a hunt for candlesticks and chart patterns. In reality, it is a complete analytical framework for reading market behavior.
It includes:
Patterns are only meaningful when they appear in the right context. Without structure, they are noise.
📌 TRUTH #3 — ONE CANDLE CONTAINS MORE INFORMATION THAN MOST INDICATORS
A single price bar is a direct record of the battle between buyers and sellers.
🟢 The body
Where price closes relative to the open shows who won that period.
🟢 The wicks
Rejections reveal failed attempts and hidden pressure.
🟢 The range
Expansion signals participation and urgency. Contraction signals balance and potential energy.
Unlike indicators, candles do not filter price. Candlesticks are price, sampled for a certain period.
📌 TRUTH #4 — INDICATORS ARE TOOLS, NOT OPPONENTS
Price Action does not require abandoning indicators.
Price is the cause.
Indicators are the effect.
Used correctly, indicators can clarify structure rather than replace it. A common example is the 20-period EMA, often used to visualize trend direction and dynamic support or resistance.
Furthermore, in Dow Theory, volume plays a secondary but critical role:
Healthy trends are confirmed by rising volume and questioned by divergence.
Indicators should support price-based decisions—not lead them.
📌 TRUTH #5 — MARKET STRUCTURE IS FRACTAL
Markets move in swings, not straight lines. These swings form structure.
This structure repeats across all timeframes. The same principles apply whether you trade intraday or position swings.
Once structure is clear, future areas of interest—including support, resistance, continuation, and failure—become easier to anticipate.
🧭 A SIMPLE PROCESS THAT ACTUALLY SCALES
Before looking for setups, follow this sequence:
Skipping the first two steps is the fastest way to overtrade and misread signals.
🎯 FINAL THOUGHT
If you removed every indicator from your chart right now, price would still be telling a story.
The question is whether you are listening—or covering it up.
They fail because they stop seeing price action.
If your chart is crowded, your thinking usually is too. This post lays out five foundational truths of modern Price Action trading. There are no new patterns to memorize, but principles that simplify decision-making across any market and timeframe.
📌 TRUTH #1 — PRICE ALREADY KNOWS EVERYTHING
Modern Price Action is rooted in Dow Theory. Its most important insight is simple:
The market price discounts everything.
All available information—fundamentals, news, sentiment, expectations—is already reflected in price.
This shifts the trader’s role from prediction to response. Instead of asking what should happen, the price action trader asks:
What is happening right now?
Once you accept price as the final authority, the chart becomes your primary source of information.
📌 TRUTH #2 — PRICE ACTION IS A FRAMEWORK, NOT A PATTERN
Price Action is often misunderstood as a hunt for candlesticks and chart patterns. In reality, it is a complete analytical framework for reading market behavior.
It includes:
- Chart patterns — structural formations that reflect shifting control
- Bar & candlestick patterns — short-term expressions of sentiment
- Market structure — swings, trends, ranges
- Context tools — support, resistance, trend lines, channels
Patterns are only meaningful when they appear in the right context. Without structure, they are noise.
📌 TRUTH #3 — ONE CANDLE CONTAINS MORE INFORMATION THAN MOST INDICATORS
A single price bar is a direct record of the battle between buyers and sellers.
🟢 The body
Where price closes relative to the open shows who won that period.
🟢 The wicks
Rejections reveal failed attempts and hidden pressure.
🟢 The range
Expansion signals participation and urgency. Contraction signals balance and potential energy.
Unlike indicators, candles do not filter price. Candlesticks are price, sampled for a certain period.
📌 TRUTH #4 — INDICATORS ARE TOOLS, NOT OPPONENTS
Price Action does not require abandoning indicators.
Price is the cause.
Indicators are the effect.
Used correctly, indicators can clarify structure rather than replace it. A common example is the 20-period EMA, often used to visualize trend direction and dynamic support or resistance.
Furthermore, in Dow Theory, volume plays a secondary but critical role:
Healthy trends are confirmed by rising volume and questioned by divergence.
Indicators should support price-based decisions—not lead them.
📌 TRUTH #5 — MARKET STRUCTURE IS FRACTAL
Markets move in swings, not straight lines. These swings form structure.
- UPTREND — higher highs and higher lows
- DOWNTREND — lower highs and lower lows
This structure repeats across all timeframes. The same principles apply whether you trade intraday or position swings.
Once structure is clear, future areas of interest—including support, resistance, continuation, and failure—become easier to anticipate.
🧭 A SIMPLE PROCESS THAT ACTUALLY SCALES
Before looking for setups, follow this sequence:
- DESCRIBE — structure, swings, key levels
- ANALYZE — trend, volatility, participation
- SELECT — only then consider entries
Skipping the first two steps is the fastest way to overtrade and misread signals.
🎯 FINAL THOUGHT
If you removed every indicator from your chart right now, price would still be telling a story.
The question is whether you are listening—or covering it up.

Price action | Founder of Trading Setups Review | tradingsetupsreview.com/ | Author of Day Trading With Price Action
Aviso legal
As informações e publicações não se destinam a ser, e não constituem, conselhos ou recomendações financeiras, de investimento, comerciais ou de outro tipo fornecidos ou endossados pela TradingView. Leia mais nos Termos de Uso.