
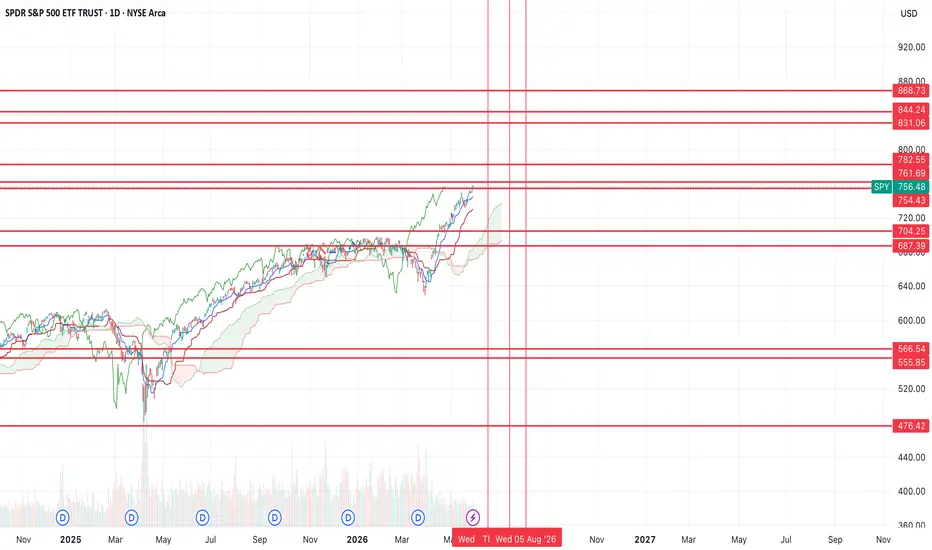
Going to update the prior idea that I had -- while I do think we're going to get the short that takes everyone out, I now do see how we can get a move to $800+ and the flows that are coming in options kind of support the view that we go higher.
I exited my all of my longs on May 14th-15th (mainly NVDA and Mara) after being long since the late March lows and I'm now looking to reenter on a pullback instead of holding my puts and vol positions.
$752 was the level I was looking to exit longs at. We hit $749 on March 14th and that was close enough for me to exit. Now that we've broken the $752 level, I still think we pullback before moving higher which is why I'm mainly in puts and cash here.
I think the short move that I was looking for in the last post will just be a shallower pullback instead of the larger move (which will play out later). I think it's likely that if we do get the pullback here, that it could be a sharp one down to the lower supports at 704 or 687, then that will setup one final move up to the upper resistances. I'll be looking to exit my short positions there, and then flip long certain names for the final move higher.
Going to use this chart as a guide going forward unless the support breaks at the lower 687 level. That will be the trigger that we're getting a much larger move down.
In terms of timelines, I think we see a pullback over the next 1-3 weeks, then long roughly into July then I'll want to be in puts/vol going into August/ September timeframe. These are rough and I'll update as I see price action play out.
Let's see what happens next.
I exited my all of my longs on May 14th-15th (mainly NVDA and Mara) after being long since the late March lows and I'm now looking to reenter on a pullback instead of holding my puts and vol positions.
$752 was the level I was looking to exit longs at. We hit $749 on March 14th and that was close enough for me to exit. Now that we've broken the $752 level, I still think we pullback before moving higher which is why I'm mainly in puts and cash here.
I think the short move that I was looking for in the last post will just be a shallower pullback instead of the larger move (which will play out later). I think it's likely that if we do get the pullback here, that it could be a sharp one down to the lower supports at 704 or 687, then that will setup one final move up to the upper resistances. I'll be looking to exit my short positions there, and then flip long certain names for the final move higher.
Going to use this chart as a guide going forward unless the support breaks at the lower 687 level. That will be the trigger that we're getting a much larger move down.
In terms of timelines, I think we see a pullback over the next 1-3 weeks, then long roughly into July then I'll want to be in puts/vol going into August/ September timeframe. These are rough and I'll update as I see price action play out.
Let's see what happens next.
Nota
I'm unsure of the direction here. Looks like we could just go straight up to stupid levels like the $800-840 level on the chart if we keep seeing semis go parabolic, but we could also fall at any moment. We're at levels never seen before. Individual names are seeing candles 20%+ outside of the bollinger bands which I haven't really seen across any assets I've watched for 8+ years. So we're truly in unique times here.Here's how I'm playing it.
I have some very small speculative call positions in NVDA and AMD that are shorter term (1 week-1 month) and adjusting sizing based on reward potential. Both have potential to be 6 figure trades if we see a crazy move. There are also other single names seeing crazy call flows. So I'm taking really small positions with short time windows that will have crazy rewards if they hit. For example, I exited NVDA a couple weeks back, but now that we've turned positive again, I've started accumulating calls again because there's potential it can still hit the upper resistance here:

Then I have longer dated VIX positions that will make a lot of money if the market decides to turn down. I like VIX calls because this will be a sell everything event when the market turns, no need to really take puts on individual names. Although I did just take profit on MSTR today, because as I posted here (tradingview.com/chart/MSTR/hi7NaOwt-MSTR-the-final-move-down/), the chart looked horrible. If I was opening new VIX, UVXY or UVIX positions, I think August/September expirations are safest.
Nota
This may be the start of the correction I was looking for. If it is, this will become much easier to trade. If we hold $688, it sets up fresh upside to the final targets. If it loses it, it's a massive short opportunity.I'll have a ton of long charts to share if it holds.
Nota
Looking like it is so far based on the price action, I sold all of my AMD and NVDA calls today, only holding uvix calls now and some index puts that I entered today and SOXS callsNota
Okay changing my mind here again, I think we just go straight up. Buying calls on a bunch of names for 8/21. Sold out of my puts now.Will share some longs shortly.
Nota
I ended up buying some 8/21 825,850Cs this morningNota
I'm still holding longs here, but we're at an inflection point. Today's low will need to continue to hold for more upside. If we lose $731 or so, then the original idea that I laid out will likely play out where we go back to $703-688. If we lose those levels it's extremely bearish.Based on what I see on the chart right now, I don't really see that extremely bearish scenario happening until around early/mid July. The reason is largely because of where we are on the vix chart, it's going to take a little bit more time to support a larger selloff.
That said, there are definitely some warning signs on the chart starting to form. I'm not sure if we make it all the way to $800 from here, but I think it's likely that we could see one more break of the highs around 5-6% up to around $766 or 778, which if we can't break those levels would create the ultimate trap as everyone would likely buy the breakout of the highs. If we break out above those levels, then the other levels to the upside are on the chart.
June 10th/ June 11th is a pivot which usually marks a high, low or continuation of the trend, so we'll have a better sense of what the next move is once we get through the week.
As of now the RSIs are still in the parabolic territory where if we do bounce, it'll create a powerful move up which is why I'm hesitant to be big picture short here. However, that will change if we continue to move lower. I think most likely here is we continue to chop until we hit the levels I mentioned above, and we'll see some dispersion continue where we see some individual stocks see large moves.
We're getting close to a big short opportunity, but it's not time just yet imo. Will continue to update this as the chart morphs.
Nota
We did end up losing that $731 level today and if you were watching it closely, you can see how once we lost that level, price starting moving down quickly. That said, I'm not sure if we'll see $703 next (yet). The reason why is because $725 is the next big support on the chart and so far price is reacting off a double bottom from yesterday and today's price action.
As long as that level continues to hold, it'll prevent a larger move down.
As I mentioned before we have a pivot today so that prevents me from getting extremely bearish here.
I'll never know what the pivot means until after the fact, but based on the price action today, it looked like capitulation of the short term trend.
RSIs on lower timeframes are extremely oversold, and they are at levels that have historically marked bottoms on the chart. The new heikin ashi candles on the 4 and 5 hr ES charts are green and it looks like we're bouncing overnight.
So my best guess here would be that it marked a low.
We shall see in the coming days if we can start a rally off these levels.
Nota
Update here: We can't seem to break above $754 and I'm starting to lean a lot more bearish than bullish. I think we're seeing fake pumps in a lot of individual names to keep the bullish hopes and ideas alive, but a lot of the charts are starting to look ugly.I've started to buy some VIX calls, I'm not really sure if we get a larger move down yet but I want to be protected incase we do.
Nota
So far so good, SPX put and VIX calls starting to print, let's see if we can get some continuation into the next week or two.
Publicações relacionadas
Aviso legal
As informações e publicações não se destinam a ser, e não constituem, conselhos ou recomendações financeiras, de investimento, comerciais ou de outro tipo fornecidos ou endossados pela TradingView. Leia mais nos Termos de Uso.
Publicações relacionadas
Aviso legal
As informações e publicações não se destinam a ser, e não constituem, conselhos ou recomendações financeiras, de investimento, comerciais ou de outro tipo fornecidos ou endossados pela TradingView. Leia mais nos Termos de Uso.