
SPY / SPX WEEKLY MARKET OUTLOOK
Last Week's Recap
We took two SPY trades last week.
The first trade came from Tuesday's Tactical Playbook after price broke out of the Chop Zone and delivered a clean long setup.
Later in the week, we attempted a tactical short from the 750–752 supply zone. The setup failed to follow through and was stopped out as planned.
2 trades | 1 win | 1 loss
(For reference, I have included last week's outlook on the right.)
UA CAPITAL RECAP 12.07 | WEEK 06–10 JUL
Week 27 of 2026 marked our first breakeven week after an incredible run of 13 consecutive deep green weeks. That winning streak, which had lasted since early April, officially came to an end. I want to mention this with complete transparency. While the deep green streak is over, we still have not recorded a single red week year to date. Hopefully a new winning streak begins soon and continues to compound over the coming months.
Markets experienced a healthy pullback during the first half of the week before finding support at lower levels. Part of that weakness was driven by renewed geopolitical uncertainty after President Trump announced that peace negotiations with Iran had been suspended and military operations would continue. Those headlines created enough uncertainty to trigger profit taking across the indices.
On Tuesday, the levels published in the Daily SPY/SPX | QQQ/NDX Tactical Playbook once again worked with remarkable precision. SPY bounced almost exactly from our predefined area before rallying toward 750. During that move, we established long exposure through ES futures and captured a solid profit.
On Wednesday, SPY tested the 740.5 level almost perfectly before closing back above it. That confirmation allowed us to re enter on the long side around 741.5. We scaled out at both 745 and 747 during Wednesday and Thursday, following the plan exactly as published.
Thursday brought a different opportunity. In the Daily SPY/SPX Tactical Playbook published that morning, I outlined a new tactical strategy for Thursday and Friday. Based on that framework, we initiated short exposure in SPY around the 750–752 supply zone while simultaneously shorting several individual equities.
This trade did not develop as expected and was stopped out according to plan. Although the SPY short failed, the bullish continuation scenario published for QQQ unfolded almost perfectly. In hindsight, the analysis itself was accurate, but our execution favored the weaker setup. Had we followed the QQQ long instead of the SPY short, the trade would have produced another profitable outcome. Sometimes the analysis is correct while execution becomes the deciding factor.
The Thursday report also highlighted the possibility of a breakout above 752. That breakout materialized on Friday exactly as anticipated.
Friday's rally was supported by renewed optimism surrounding geopolitical developments as headlines suggested that peace negotiations could resume. Despite the breakout, the UA CAPITAL Trading Desk decided not to participate because the move developed late on Friday afternoon, when option pinning and positioning distortions become much more likely. We preferred to finish the week flat rather than force a late entry.
Overall, the week reflected disciplined execution. Tuesday's Tactical Playbook generated profitable futures trades, while Wednesday and Thursday's long positions produced additional gains. Those profits were offset by Thursday's unsuccessful short positions across both the indices and several equities. By staying disciplined with our risk management, the week finished essentially flat.
Although our 13 week deep green streak came to an end, our year to date record remains free of any losing weeks. That consistency is not simply the result of good market analysis. It is the product of disciplined risk management and strict position sizing.
Equities Play
This week we also began building several medium term spot positions together with the UA CAPITAL Trading Desk.
To maintain flexibility, total exposure was intentionally limited to approximately one quarter of our available buying power.
Over the coming weeks, we plan to continue accumulating positions at predefined technical levels with the intention of holding them into the November–December 2026 timeframe.
The individual names are shared exclusively inside the private Trading Desk, so I will not disclose them publicly. However, the portfolio remains concentrated primarily in technology and semiconductor companies.
This Week's Scenarios / Prediction
Risk Index
This oscillator reads macro conditions and converts them into a technical risk framework. It was developed internally at UA CAPITAL and remains the primary indicator I use for both short term and long term positioning decisions.
The Risk Index algorithm is currently signaling a short term neutral to slightly bullish environment. Additional upside remains possible over the near term, although the market continues to trade within a broader choppy structure.
The long term algorithm continues to signal a risk on environment, while the medium term outlook still leans slightly bearish.
When these conditions occur simultaneously, volatility typically increases as both buyers and sellers compete for control. Eventually, this type of environment often resolves through either a meaningful correction or a decisive breakout that establishes the next directional trend.
Our approach this week remains straightforward. We will continue looking for confirmed long opportunities from predefined Key Levels. At this stage, I believe short positions carry a less attractive risk to reward profile. Should that view change, I will communicate it through the daily Tactical Playbooks.
Scenarios / Strategies
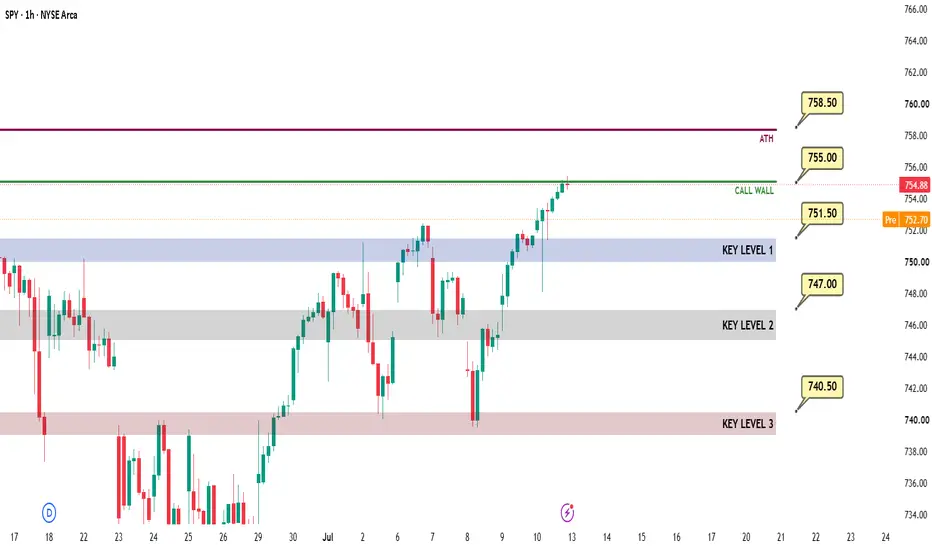
Long Scenario 1
KEY Level 1 (751.5)
This is the first major demand zone. If price reaches this level and confirms support, call options can be used to establish long exposure.
Trigger: Price must reach the level and produce a bullish 1 hour candle close back above the zone.
Targets:754.5 → 758 → 760
Invalidation: Daily close below 748.
Long Scenario 2
KEY Level 2 (747)
This is the second major demand zone. If price reaches this level and confirms support, call options can be used to establish long exposure.
Trigger: Price must reach the level and produce a bullish daily close back above the zone.
Targets: 750 → 751.5 → 754.5
Invalidation: Daily close below 745.
Long Scenario 3
KEY Level 3 (740.5) This is the third major demand zone. If price reaches this level and confirms support, call options can be used to establish long exposure.
Trigger: Price must reach the level and produce a bullish daily close back above the zone.
Targets: 742.5 → 745 → 747
Invalidation: Daily close below 739
Position Management Rules
1. Entry model: Aggressive: 1 hour candle close above/below the designated level. Conservative: Daily candle close above/below the designated level.
2. Take profits in stages because market reversals can happen quickly.
3. After the first profit target is reached, move all remaining stop losses to breakeven and convert the position into a risk free trade.
4. A reaction from the level must be confirmed. We do not predict price. We react to price.
5. Daily candle close below the designated bounce zone equals stop loss.
Notice: Starting a fresh, fully transparent track record for SPY, QQQ, and core equities here on TradingView. Going forward, all daily market updates, institutional research, weekly outlooks, and mid week market updates will be documented and tracked consistently.
This analysis is for educational purposes only and reflects my personal opinion. It is not financial advice.
Last Week's Recap
We took two SPY trades last week.
The first trade came from Tuesday's Tactical Playbook after price broke out of the Chop Zone and delivered a clean long setup.
Later in the week, we attempted a tactical short from the 750–752 supply zone. The setup failed to follow through and was stopped out as planned.
2 trades | 1 win | 1 loss
(For reference, I have included last week's outlook on the right.)
UA CAPITAL RECAP 12.07 | WEEK 06–10 JUL
Week 27 of 2026 marked our first breakeven week after an incredible run of 13 consecutive deep green weeks. That winning streak, which had lasted since early April, officially came to an end. I want to mention this with complete transparency. While the deep green streak is over, we still have not recorded a single red week year to date. Hopefully a new winning streak begins soon and continues to compound over the coming months.
Markets experienced a healthy pullback during the first half of the week before finding support at lower levels. Part of that weakness was driven by renewed geopolitical uncertainty after President Trump announced that peace negotiations with Iran had been suspended and military operations would continue. Those headlines created enough uncertainty to trigger profit taking across the indices.
On Tuesday, the levels published in the Daily SPY/SPX | QQQ/NDX Tactical Playbook once again worked with remarkable precision. SPY bounced almost exactly from our predefined area before rallying toward 750. During that move, we established long exposure through ES futures and captured a solid profit.
On Wednesday, SPY tested the 740.5 level almost perfectly before closing back above it. That confirmation allowed us to re enter on the long side around 741.5. We scaled out at both 745 and 747 during Wednesday and Thursday, following the plan exactly as published.
Thursday brought a different opportunity. In the Daily SPY/SPX Tactical Playbook published that morning, I outlined a new tactical strategy for Thursday and Friday. Based on that framework, we initiated short exposure in SPY around the 750–752 supply zone while simultaneously shorting several individual equities.
This trade did not develop as expected and was stopped out according to plan. Although the SPY short failed, the bullish continuation scenario published for QQQ unfolded almost perfectly. In hindsight, the analysis itself was accurate, but our execution favored the weaker setup. Had we followed the QQQ long instead of the SPY short, the trade would have produced another profitable outcome. Sometimes the analysis is correct while execution becomes the deciding factor.
The Thursday report also highlighted the possibility of a breakout above 752. That breakout materialized on Friday exactly as anticipated.
Friday's rally was supported by renewed optimism surrounding geopolitical developments as headlines suggested that peace negotiations could resume. Despite the breakout, the UA CAPITAL Trading Desk decided not to participate because the move developed late on Friday afternoon, when option pinning and positioning distortions become much more likely. We preferred to finish the week flat rather than force a late entry.
Overall, the week reflected disciplined execution. Tuesday's Tactical Playbook generated profitable futures trades, while Wednesday and Thursday's long positions produced additional gains. Those profits were offset by Thursday's unsuccessful short positions across both the indices and several equities. By staying disciplined with our risk management, the week finished essentially flat.
Although our 13 week deep green streak came to an end, our year to date record remains free of any losing weeks. That consistency is not simply the result of good market analysis. It is the product of disciplined risk management and strict position sizing.
Equities Play
This week we also began building several medium term spot positions together with the UA CAPITAL Trading Desk.
To maintain flexibility, total exposure was intentionally limited to approximately one quarter of our available buying power.
Over the coming weeks, we plan to continue accumulating positions at predefined technical levels with the intention of holding them into the November–December 2026 timeframe.
The individual names are shared exclusively inside the private Trading Desk, so I will not disclose them publicly. However, the portfolio remains concentrated primarily in technology and semiconductor companies.
This Week's Scenarios / Prediction
Risk Index
This oscillator reads macro conditions and converts them into a technical risk framework. It was developed internally at UA CAPITAL and remains the primary indicator I use for both short term and long term positioning decisions.
The Risk Index algorithm is currently signaling a short term neutral to slightly bullish environment. Additional upside remains possible over the near term, although the market continues to trade within a broader choppy structure.
The long term algorithm continues to signal a risk on environment, while the medium term outlook still leans slightly bearish.
When these conditions occur simultaneously, volatility typically increases as both buyers and sellers compete for control. Eventually, this type of environment often resolves through either a meaningful correction or a decisive breakout that establishes the next directional trend.
Our approach this week remains straightforward. We will continue looking for confirmed long opportunities from predefined Key Levels. At this stage, I believe short positions carry a less attractive risk to reward profile. Should that view change, I will communicate it through the daily Tactical Playbooks.
Scenarios / Strategies
Long Scenario 1
KEY Level 1 (751.5)
This is the first major demand zone. If price reaches this level and confirms support, call options can be used to establish long exposure.
Trigger: Price must reach the level and produce a bullish 1 hour candle close back above the zone.
Targets:754.5 → 758 → 760
Invalidation: Daily close below 748.
Long Scenario 2
KEY Level 2 (747)
This is the second major demand zone. If price reaches this level and confirms support, call options can be used to establish long exposure.
Trigger: Price must reach the level and produce a bullish daily close back above the zone.
Targets: 750 → 751.5 → 754.5
Invalidation: Daily close below 745.
Long Scenario 3
KEY Level 3 (740.5) This is the third major demand zone. If price reaches this level and confirms support, call options can be used to establish long exposure.
Trigger: Price must reach the level and produce a bullish daily close back above the zone.
Targets: 742.5 → 745 → 747
Invalidation: Daily close below 739
Position Management Rules
1. Entry model: Aggressive: 1 hour candle close above/below the designated level. Conservative: Daily candle close above/below the designated level.
2. Take profits in stages because market reversals can happen quickly.
3. After the first profit target is reached, move all remaining stop losses to breakeven and convert the position into a risk free trade.
4. A reaction from the level must be confirmed. We do not predict price. We react to price.
5. Daily candle close below the designated bounce zone equals stop loss.
Notice: Starting a fresh, fully transparent track record for SPY, QQQ, and core equities here on TradingView. Going forward, all daily market updates, institutional research, weekly outlooks, and mid week market updates will be documented and tracked consistently.
This analysis is for educational purposes only and reflects my personal opinion. It is not financial advice.
Trade fechado: objetivo atingido
Long Scenario 1 worked exactly as planned this week.During Tuesday's morning session, price first retested Key Level 1 and then gave us the confirmation trigger by closing above 751.5.
We entered the trade at approximately 752.5 and targeted 754.5 as our first profit taking level.
Price reached that target, where we took our first partial profits and immediately moved the stop loss on the remaining position to breakeven.
The rest of the position was eventually stopped out at breakeven, but the first partial locked in a significant profit.
Overall, Long Scenario 1 performed exactly as designed and delivered a solid trade.

Publicações relacionadas
Aviso legal
As informações e publicações não se destinam a ser, e não constituem, conselhos ou recomendações financeiras, de investimento, comerciais ou de outro tipo fornecidos ou endossados pela TradingView. Leia mais nos Termos de Uso.
Publicações relacionadas
Aviso legal
As informações e publicações não se destinam a ser, e não constituem, conselhos ou recomendações financeiras, de investimento, comerciais ou de outro tipo fornecidos ou endossados pela TradingView. Leia mais nos Termos de Uso.