Greetings everyone,
(Key Takeaways) - (MONTHLY TIMEFRAME)
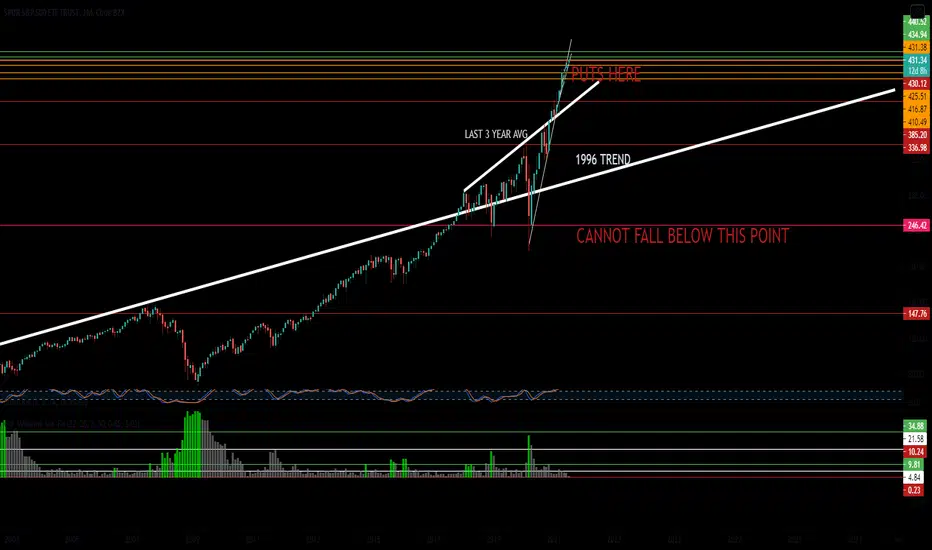
This SPY chart dating back to the date it was listed on the market back in 1993 gives us a wider point of view of the market.
Overall the sentiment is still bullish-long. However, the next couple of months can be bloodbaths.
Easy to say we are a bit over-extended? The smallest white trendline (2017-NOW) is showing signs of weakness.
Possible downward move towards $416.00 in the next couple of weeks.
The longer white trendline shows a possible 100 point loss down to $340.00.
Keep in mind we are entering earnings season so the risk is very high.
(My sentiment)
Bearish - Short term
Bullish - Long term
(Key Takeaways) - (MONTHLY TIMEFRAME)
This
SPY chart dating back to the date it was listed on the market back in 1993 gives us a wider point of view of the market.Overall the sentiment is still bullish-long. However, the next couple of months can be bloodbaths.
Easy to say we are a bit over-extended? The smallest white trendline (2017-NOW) is showing signs of weakness.
Possible downward move towards $416.00 in the next couple of weeks.
The longer white trendline shows a possible 100 point loss down to $340.00.
Keep in mind we are entering earnings season so the risk is very high.
(My sentiment)
Bearish - Short term
Bullish - Long term

Publicações relacionadas
Aviso legal
As informações e publicações não se destinam a ser, e não constituem, conselhos ou recomendações financeiras, de investimento, comerciais ou de outro tipo fornecidos ou endossados pela TradingView. Leia mais nos Termos de Uso.
Publicações relacionadas
Aviso legal
As informações e publicações não se destinam a ser, e não constituem, conselhos ou recomendações financeiras, de investimento, comerciais ou de outro tipo fornecidos ou endossados pela TradingView. Leia mais nos Termos de Uso.