
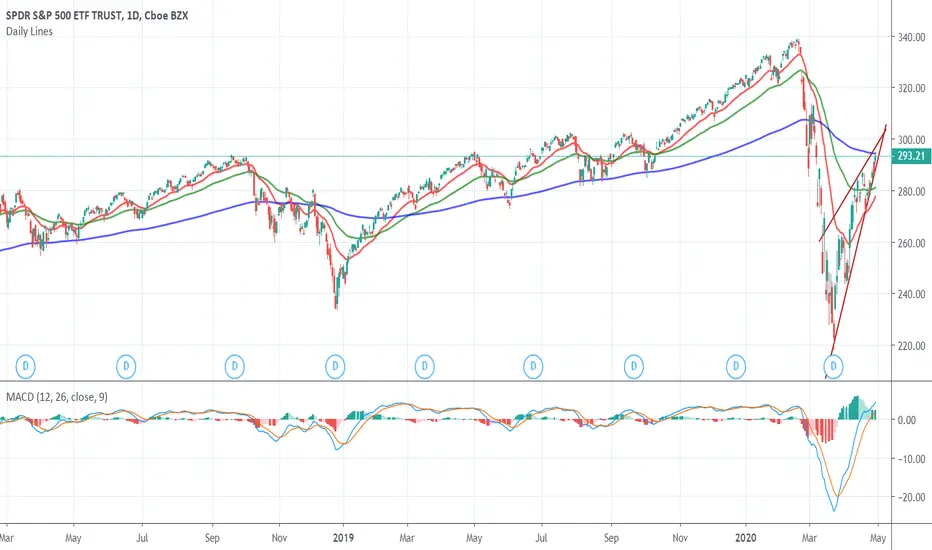
SPY ETF (S&P500) has reached its 200 EMA at $294 (purple line). This is a significant level, as it may serve as resistance. If we break through $300, then the market may continue going up to $340. 50 day EMA (red) is close to crossing 100 day EMA (green) from below, pointing toward higher prices. MACD chart is near the top, but is still pointing upward. Based on technicals, the rally may continue. Caution may be a good approach to taking long exposure, as traders are selling into these rallies. The fundamentals remain bearish.

Aviso legal
As informações e publicações não se destinam a ser, e não constituem, conselhos ou recomendações financeiras, de investimento, comerciais ou de outro tipo fornecidos ou endossados pela TradingView. Leia mais nos Termos de Uso.
Aviso legal
As informações e publicações não se destinam a ser, e não constituem, conselhos ou recomendações financeiras, de investimento, comerciais ou de outro tipo fornecidos ou endossados pela TradingView. Leia mais nos Termos de Uso.