
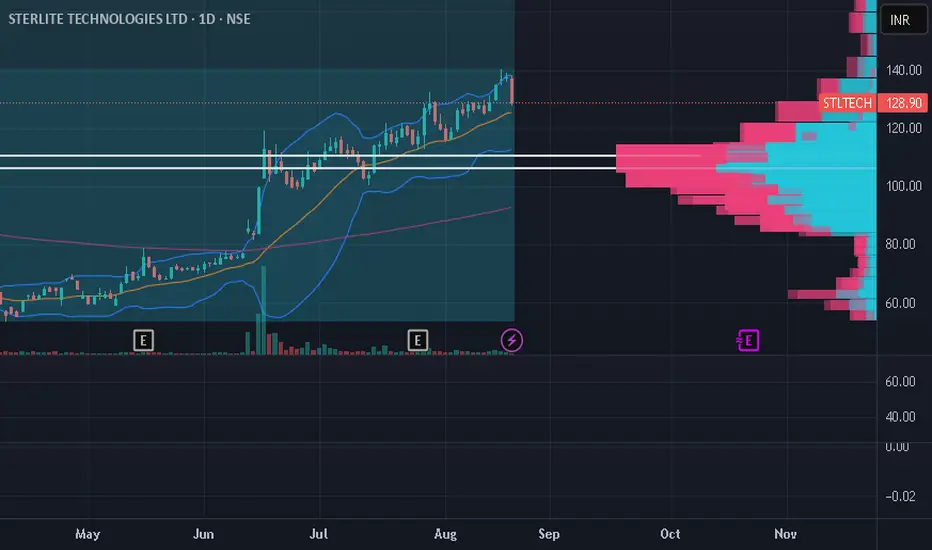
## Carborundum Universal Share Price Action Analysis & Fundamental Review### **Price Action Analysis**Carborundum Universal exhibited a dramatic **technical breakout** on August 20, 2025, with the stock surging **13.82%** to close at **₹990.25** from the previous day's close of ₹870.05. This represented the highest single-day gain in the recent period, accompanied by exceptional trading volumes of **4.78 million shares**—significantly higher than the typical daily average.[1][2]**Key Technical Observations:**
- **Consolidation Phase**: The stock traded in a narrow range between ₹833-885 from August 7-19, forming a strong base[2]
- **Breakout Pattern**: The August 20 surge broke through multiple resistance levels with strong volume confirmation[1][3]
- **Volatility Range**: Over the past month, the stock ranged from a low of ₹833.05 to a high of ₹1,018.00, indicating high volatility of **18.6%**[2]
- **Moving Average Signals**: Both 10-day and 50-day moving average crossovers appeared, historically indicating average gains of 4-6% within 7-30 days[1]
### **Fundamental Analysis****Financial Health Overview:**
Carborundum Universal demonstrates **strong balance sheet fundamentals** but faces **profitability challenges** in the recent quarter.[4][5]
#### **ROCE & ROE Analysis**
| **Metric** | **Mar 2025** | **Mar 2024** | **Change** | **5-Year Trend** |
|------------|--------------|--------------|------------|------------------|
| **ROE** | 9.06% | 16.14% | **-43.87%** | Declining from 17.16% peak |
| **ROCE** | 14.00% | 21.28% | **-34.21%** | Down from 21.47% in 2023 |
**ROE Analysis:**
- Current ROE of **9.06%** is significantly below the industry benchmark and the company's historical performance[6][7]
- The sharp decline from 16.14% to 9.06% reflects **reduced profitability** relative to shareholder equity[7]
- The 5-year average ROE of **14.6%** suggests the current level is temporarily depressed[7]
**ROCE Analysis:**
- ROCE dropped to **14.00%** from a consistent **20%+ range** maintained over 2021-2024[6]
- This indicates **declining efficiency** in generating profits from capital employed[6]
- Despite the decline, 14% ROCE still represents reasonable capital efficiency compared to risk-free returns[6]
#### **Key Financial Strengths**
**Balance Sheet Quality:**
- **Debt-to-Equity Ratio**: Excellent at **0.03x**, down from 0.04x, indicating virtually **debt-free operations**[8][9]
- **Current Ratio**: Strong liquidity at **3.64x**, improved from 3.41x[10]
- **Cash Position**: Robust free cash flow generation at **98% of PAT** at consolidated level[11]
**Operational Metrics:**
- **Revenue Growth**: Modest **1.79% YoY** growth in Q1 FY26 to ₹1,238 crores[12]
- **Segment Performance**: Ceramics (+11.1%) and Electrominerals (+6.3%) showed growth, while Abrasives declined (-8%)[13][12]
- **Market Position**: Leadership across abrasives, ceramics, and electrominerals with strong brand presence[12]
#### **Key Concerns**
**Profitability Pressure:**
- **Net Profit**: Declined **47.4% YoY** to ₹60 crores in Q1 FY26[13][12]
- **Operating Margin**: Compressed to **6.55%** from 12.38% in previous year[1][13]
- **Cost Inflation**: Total expenses surged **9.64% YoY** due to raw material and energy cost pressures[12][13]
**Valuation Concerns:**
- **PE Ratio**: High at **68.56x**, indicating expensive valuation relative to earnings[14][1]
- **PB Ratio**: Premium at **4.51x** compared to book value[15]
- **Trading Premium**: Currently trading at **29% premium** to intrinsic value estimates[4]
### **Investment Outlook****Short-term Prospects:**
The technical breakout suggests **bullish momentum** could continue, with immediate resistance at ₹1,018 and support around ₹870-885. However, investors should be cautious of **profit-taking** after the sharp surge.[1][2]
**Medium-term Fundamentals:**
While the balance sheet remains strong with minimal debt, the **deteriorating profitability metrics** and **margin compression** are concerning. Management's focus on **cost optimization** and **operational efficiencies** will be crucial for recovery.[12]
**Risk Factors:**
- High valuation multiples leave little margin for error
- Continued cost inflation pressure on margins
- Dependence on cyclical industrial demand
**Conclusion:**
Carborundum Universal presents a **mixed investment proposition**—technically attractive with strong balance sheet fundamentals, but challenged by declining profitability and high valuations. The recent breakout may offer trading opportunities, but long-term investors should monitor the company's ability to restore margin health and improve capital efficiency before making significant commitments.
[1] economictimes.indiatimes.com/carborundum-universal-ltd/stocks/companyid-13909.cms
[2] equitypandit.com/historical-data/CARBORUNIV
[3] in.tradingview.com/symbols/NSE-CARBORUNIV/
[4] smart-investing.in/main.php?Company=CARBORUNDUM+UNIVERSAL+LTD
[5] screener.in/company/CARBORUNIV/consolidated/
[6] smart-investing.in/financial-ratios.php?Company=CARBORUNDUM+UNIVERSAL+LTD&p=ROCE
[7] smart-investing.in/financial-ratios.php?Company=CARBORUNDUM+UNIVERSAL+LTD&p=ROE
[8] smart-investing.in/financial-ratios.php?Company=CARBORUNDUM+UNIVERSAL+LTD&p=Total+Debt/Equity
[9] cumi-murugappa.com/wp-content/uploads/2025/08/Q1-FY-2025-26-Earnings-Call-Transcript-1.pdf
[10] moneycontrol.com/financials/carborundumuniversal/ratiosVI/cu
[11] ca.finance.yahoo.com/news/carborundum-universal-ltd-bom-513375-070241856.html
[12] alphastreet.com/india/carborundum-universal-q1-fy26-earnings-results/
[13] business-standard.com/markets/capital-market-news/carborundum-universal-drops-after-q1-pat-slides-45-yoy-to-rs-62-cr-125080700978_1.html
[14] smart-investing.in/pe-ratio.php?Company=CARBORUNDUM+UNIVERSAL+LTD
[15] moneycontrol.com/india/stockpricequote/abrasives/carborundumuniversal/CU
[16] perplexity.ai/finance/CARBORUNIV.BO
[17] tourismjk.in/forecast2025/Carborundum-Universal-Limited-(513375)-Stock-Experiences-Sudden-Dip
[18] nseindia.com/get-quotes/equity?symbol=CARBORUNIV
[19] simplywall.st/stocks/in/materials/nse-carboruniv/carborundum-universal-shares/future
[20] finance.yahoo.com/quote/CARBORUNIV.NS/history/
[21] kotaksecurities.com/financial-results/carborundum-universal-ltd-q1fy2025-26-results/
[22] icicidirect.com/stocks/carborundum-universal-ltd-share-price
[23] choiceindia.com/stocks/carborundum-universal-ltd-share-price-history
[24] psms.bits-pilani.ac.in/key-takeaways/Is-Carborundum-Universal-Limited-Stock-Poised-for-a-Breakout-in-2025
[25] tourismjk.in/technicalanalysis/Carborundum-Universal-Limited-(CARBORUNIV)-Stock-Rallies
[26] goodreturns.in/company/carborundum-universal/ratios.html
[27] ppl-ai-code-interpreter-files.s3.amazonaws.com/web/direct-files/0cc3a9ac853366be4771f25e74ea5553/e4839cc5-17b4-4a1a-a723-d8402a11e504/7bd86297.csv
[28] ppl-ai-code-interpreter-files.s3.amazonaws.com/web/direct-files/0cc3a9ac853366be4771f25e74ea5553/d4717c6e-53ff-4b85-9a74-3f56fd7585b1/969447a5.csv
[29] ppl-ai-code-interpreter-files.s3.amazonaws.com/web/direct-files/0cc3a9ac853366be4771f25e74ea5553/d4717c6e-53ff-4b85-9a74-3f56fd7585b1/e8b2f04b.csv

Aviso legal
As informações e publicações não se destinam a ser, e não constituem, conselhos ou recomendações financeiras, de investimento, comerciais ou de outro tipo fornecidos ou endossados pela TradingView. Leia mais nos Termos de Uso.
Aviso legal
As informações e publicações não se destinam a ser, e não constituem, conselhos ou recomendações financeiras, de investimento, comerciais ou de outro tipo fornecidos ou endossados pela TradingView. Leia mais nos Termos de Uso.